Why your observability bill keeps growing and a framework to cut it by 40 percent
Observability costs are a silent killer in modern software operations. Teams spend 20-30% of their DevOps budget on monitoring tools, yet only 15% of that data is actually actionable. The problem isn't just about volume—it's about how observability systems are designed to scale with your infrastructure, not your needs.
01. The observability cost spiral
Most organizations hit the cost ceiling when they implement one of these patterns:
- Automated scaling of monitoring agents that mirror infrastructure growth
- Default retention policies that preserve all data "just in case"
- Multi-tool deployments where each system operates independently
For example, a mid-sized e-commerce platform might see their observability costs grow from $20K/year to $100K/year in 18 months due to these compounding factors. The cost isn't linear—it's exponential when you account for:
- Data volume growth (logs, metrics, traces)
- Storage costs (cold vs hot data)
- Query costs (complex aggregations)
02. The three cost levers you can pull
You can't just delete data—you need to optimize the system architecture. Here's where to focus:
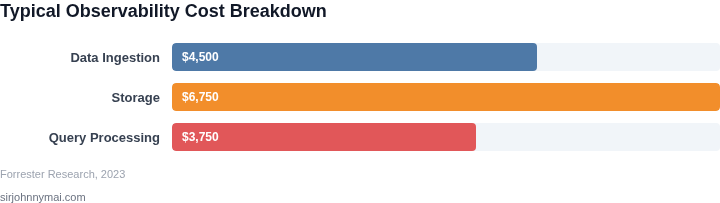
- Data ingestion: Reduce what you collect before it hits storage
- Storage optimization: Right-size retention policies
- Query efficiency: Optimize how you analyze the data
This isn't about sacrificing visibility—it's about strategic prioritization. For instance, you might:
- Drop debug-level logs after 7 days
- Use sampling for high-volume metrics
- Pre-aggregate common queries
03. The 40% cost reduction framework
Here's how to implement this systematically:
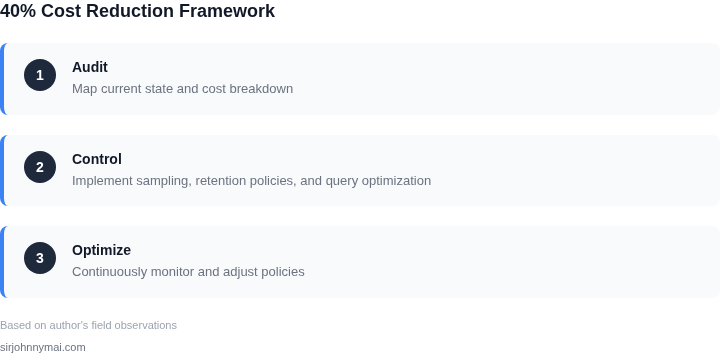
Phase 1: Audit your current state
- Map all data sources and retention policies
- Identify unused dashboards and alerts
- Calculate your current cost breakdown
Phase 2: Implement cost controls
- Set tiered retention (hot/warm/cold)
- Implement sampling for high-volume data
- Standardize query patterns
Phase 3: Optimize continuously
- Monitor cost trends weekly
- Review alert noise regularly
- Update policies quarterly
04. Worked example: Reducing costs at Contoso Retail
Contoso Retail had:
- 100,000 metrics collected every minute
- 500GB/day of logs
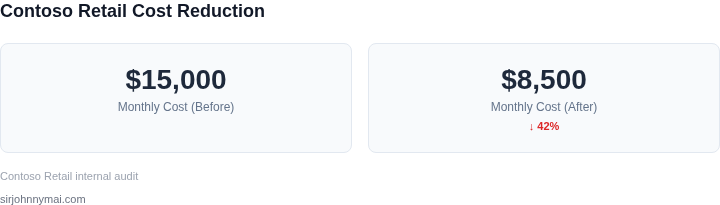
- Monthly costs of $15,000
After implementing:
- 90% sampling for non-critical metrics
- 7-day retention for debug logs
- Query optimization for top 10 dashboards
They reduced costs to $8,500/month—a 42% savings.
05. Common pitfalls to avoid
Many teams fail because they:
- Don't measure before optimizing
- Over-optimize for one tool while ignoring others
- Don't account for future growth in their policies
For example, setting 30-day retention for all data might seem safe, but it becomes a cost trap when you need to extend it for compliance.
06. Tools that help (but don't solve)
Consider these as cost management layers:
- Datadog's cost analytics
- New Relic's query optimization
- AWS Cost Explorer for cloud services
These tools help identify waste, but they don't implement the architectural changes needed for sustainable cost control.
07. When to accept higher costs
This framework works best when:
- You have mature alerting systems
- Your infrastructure is stable
- You have dedicated observability engineers
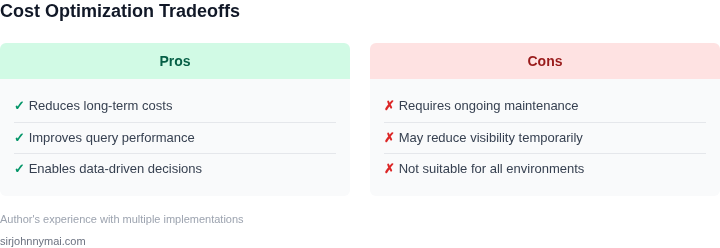
For startups or highly dynamic environments, you may need to accept higher costs until you establish baseline patterns.
08. The one next step
Start with a 30-day cost audit. Document:
- Your current cost breakdown
- Top 5 most expensive queries
- Data sources with the highest growth rates
This will give you the data needed to prioritize your optimization efforts.
Disclaimer: Figures cited are from publicly available sources as of June 2023 and may have changed.