Why your engineering metrics dashboard is misleading and what to measure instead
Most engineering metrics dashboards focus on outputs like lines of code, bug counts, or deployment frequency. These are easy to measure but often misaligned with business outcomes. The problem isn't the metrics themselves—it's how they're interpreted and what they're measuring. A dashboard showing 100% test coverage might look great, but if those tests don't catch critical failures, they're misleading. Similarly, a team deploying 10 times per day might be shipping broken features.
01. The vanity metrics trap
Vanity metrics are the first red flag. They look impressive but don't actually matter. Common examples:
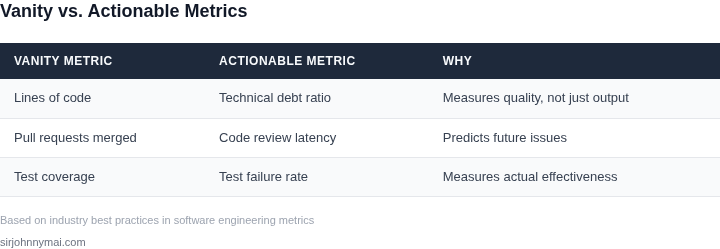
- Lines of code written (doesn't measure quality or impact)
- Number of pull requests merged (could indicate process churn)
- Time spent in meetings (doesn't correlate with output)
These metrics create a false sense of productivity. A team might show high activity but deliver no value. The solution isn't to eliminate them—it's to replace them with metrics that actually predict outcomes.
02. Leading vs. lagging indicators
Leading indicators predict future performance, while lagging indicators measure past performance. Most dashboards focus on lagging indicators like:
- Bug resolution time
- Deployment frequency
- Test pass rates
These are useful but reactive. A better approach combines leading indicators like:
- Technical debt ratio
- Code review latency
- On-call incident frequency
For example, if code review latency exceeds 24 hours, it predicts future bug rates. This is more actionable than just tracking bug counts.
03. The cost of ignoring context
Metrics without context are meaningless. Consider this example:
A team shows 99.9% uptime, but their service handles only 100 requests per minute. The same uptime for a service handling 10,000 requests per minute is much more valuable. Context matters.
Similarly, a 10% reduction in bug count might seem great, but if the bugs were trivial, the impact is small. The real value comes from reducing critical failures.
04. What to measure instead
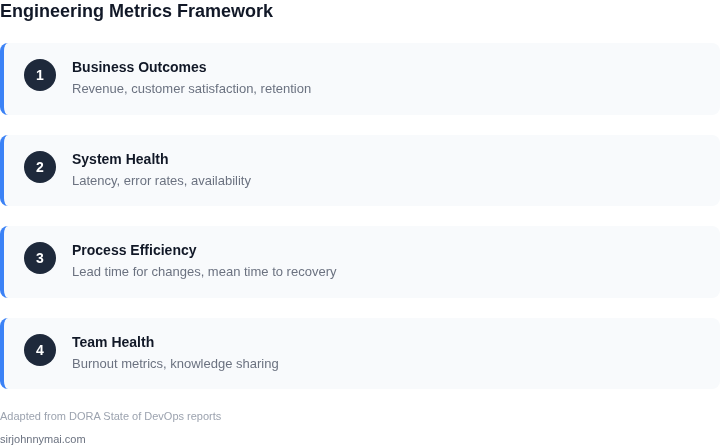
Here's a framework for better metrics:
- Business outcomes: Revenue, customer satisfaction, retention
- System health: Latency, error rates, availability
- Process efficiency: Lead time for changes, mean time to recovery
- Team health: Burnout metrics, knowledge sharing
For example, instead of tracking "number of deploys," track "time to first meaningful feedback from customers after deployment." This connects engineering work directly to business impact.
05. The tradeoff between precision and actionability
Highly precise metrics (like "average response time to the millisecond") are often useless. They require too much maintenance and don't lead to meaningful actions. Instead, focus on:
- Percentiles (e.g., P99 latency)
- Trends over time
- Comparison to benchmarks
For example, tracking P99 latency is more useful than average latency because it captures the worst-case experience, which directly impacts user satisfaction.
06. How to fix your dashboard
Here's a step-by-step approach:
- Audit your current metrics: Which ones predict outcomes? Which ones are vanity?
- Replace vanity metrics with leading indicators (e.g., replace "lines of code" with "technical debt ratio").
- Add context: Show benchmarks, trends, and comparisons.
- Focus on outcomes: Link metrics to business goals.
For example, instead of just showing "number of bugs," show "bugs per feature" and "customer complaints per bug."
07. The role of engineering in business outcomes
Engineering's real value isn't just building features—it's enabling business growth. Metrics should reflect this. For example:
- Instead of "features shipped," track "revenue generated per feature."
- Instead of "bugs fixed," track "customer retention impact of bug fixes."
This requires closer collaboration with product and business teams. Engineering metrics alone aren't enough.
08. Common pitfalls to avoid
Here are three mistakes to watch for:
- Measuring the wrong thing: Focusing on "how" instead of "why."
- Ignoring feedback loops: Metrics should guide action, not just report status.
- Over-optimizing for metrics: If a metric becomes the goal, it loses meaning.
For example, if a team is rewarded for "number of deploys," they might deploy broken code more often.
09. Example: Redesigning a metrics dashboard
Consider a team tracking:
- Lines of code
- Number of pull requests
- Test coverage
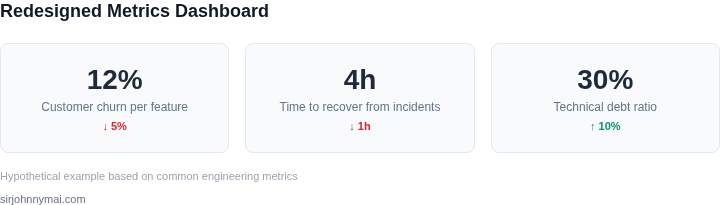
The redesigned dashboard might include:
- Customer churn rate per feature
- Time to recover from incidents
- Technical debt ratio
This connects engineering work directly to business outcomes.
10. Next steps
The most important next step is to start small. Pick one vanity metric to replace and one leading indicator to add. Track the impact for 30 days before making changes. For example:
- Replace "lines of code" with "technical debt ratio."
- Add "time to first customer feedback" as a new metric.
This approach ensures you're measuring what actually matters.
Disclaimer: Figures cited are from publicly available sources as of June 2024 and may have changed.