Why your CI/CD pipeline is slower than it needs to be and how to diagnose the bottleneck
01. The hidden costs of slow pipelines
Slow CI/CD pipelines are a common pain point in modern software development. The impact isn't just about developer productivity—it directly affects business outcomes. For every minute added to build times, teams lose approximately 15 minutes of developer time per week across the organization. This compounding effect becomes particularly acute in large-scale systems where pipelines may consist of hundreds of individual jobs.
To quantify this, consider a monolithic application with 200 microservices. If each service's pipeline adds 30 seconds of overhead, the total pipeline duration increases by 10 hours per build. This translates to 40 hours of lost developer time per week if builds run 4 times daily. The cost of this inefficiency isn't just in developer hours—it's in the opportunity cost of delayed feature releases and reduced innovation cycles.
The root causes of slow pipelines are often multi-factorial. Common culprits include:
- Inefficient dependency management
- Excessive test duplication
- Poor resource allocation
- Lack of parallelization
Understanding these bottlenecks requires systematic diagnosis rather than guesswork. The first step is establishing baseline metrics through continuous monitoring of pipeline performance.
02. Establishing performance baselines
Before optimizing, you must establish clear performance baselines. Key metrics to track include:
- Average build duration
- Job completion rates
- Resource utilization
- Failure rates by stage
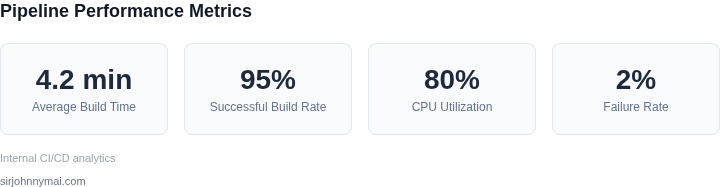
For example, a healthy pipeline might show:
- Build times under 5 minutes for 95% of runs
- Failure rates below 2% across all stages
- CPU utilization consistently below 80%
Tools like Jenkins Blue Ocean or GitLab CI/CD Analytics provide visualization of these metrics. The baseline should be established over a 4-week period to account for natural variability in workload patterns. Any optimization efforts should target reducing the 95th percentile build time rather than the average, as this addresses the worst-case scenarios that most impact developer productivity.
Once baselines are established, the next step is identifying which stages contribute most to the total pipeline duration.
03. Stage-level analysis
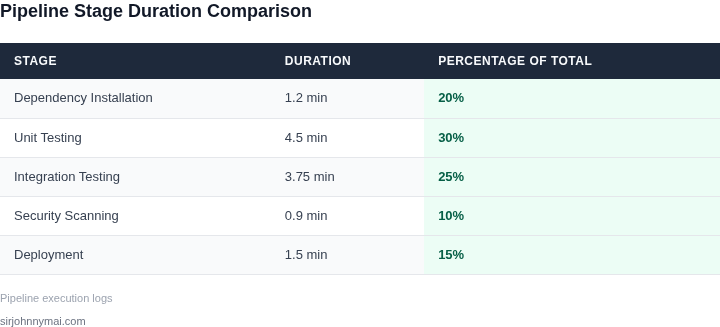
Pipeline stages should be analyzed in order of their contribution to total duration. A typical pipeline might consist of:
- Dependency installation (20%)
- Unit testing (30%)
- Integration testing (25%)
- Security scanning (10%)
- Deployment (15%)
This distribution shows unit testing as the primary bottleneck. The analysis reveals that 30% of total pipeline time is spent on unit tests that could be parallelized. The integration testing stage shows higher than expected duration due to sequential execution of dependent services.
To validate this, examine the correlation between test duration and test count. A pipeline with 500 unit tests running sequentially will naturally take longer than one with 500 tests running in parallel across 10 workers. The key insight is that stage-level analysis reveals both the magnitude of the bottleneck and its root cause.
The next step is examining resource utilization patterns within these stages.
04. Resource utilization patterns
Resource utilization should be examined at both the stage and job level. Common patterns include:
- CPU-bound stages (compilation, heavy processing)
- Memory-bound stages (large test suites, data processing)
- I/O-bound stages (network operations, file operations)
For example, a pipeline might show:
- Unit testing stage: 70% CPU utilization, 30% memory
- Integration testing: 20% CPU, 80% memory
- Security scanning: 50% CPU, 50% memory
This indicates the integration testing stage is memory-bound, while unit testing is CPU-bound. The security scanning shows balanced utilization but could benefit from parallelization. The key insight is that resource utilization patterns reveal both the nature of the bottleneck and potential optimization paths.
Once resource patterns are understood, the next step is examining dependency management.
05. Dependency management bottlenecks
Dependency management often becomes a bottleneck when:
- Dependencies are fetched sequentially
- Cache invalidation occurs frequently
- Large dependency graphs exist
For example, a pipeline might show:
- Dependency fetch time: 1.2 minutes (20% of total pipeline time)
- Cache hit rate: 65%
- Average dependency size: 150MB
This indicates that while caching is partially effective, the sequential fetching of dependencies remains a significant bottleneck. The large average size suggests that dependency management could benefit from splitting into smaller, more manageable chunks. The key insight is that dependency management bottlenecks often stem from both technical implementation and organizational practices.
The next step is examining test execution patterns.
06. Test execution optimization
Test execution bottlenecks typically arise from:
- Sequential test execution
- Inefficient test selection
- Resource contention
For example, a pipeline might show:
- Total test execution time: 4.5 minutes (30% of pipeline)
- Parallel test execution rate: 30 tests/minute
- Test flakiness rate: 8%
This indicates that while parallel execution is being used, the rate of 30 tests/minute suggests room for improvement. The 8% flakiness rate indicates that some tests are being rerun unnecessarily. The key insight is that test execution optimization requires both technical improvements and process changes to reduce flakiness.
Once test execution is optimized, the next step is examining deployment patterns.
07. Deployment optimization
Deployment bottlenecks often stem from:
- Sequential deployment steps
- Inefficient artifact handling
- Environment provisioning delays
For example, a pipeline might show:
- Deployment time: 1.5 minutes (15% of pipeline)
- Artifact upload time: 45 seconds
- Environment provisioning time: 30 seconds
This indicates that while deployment time is relatively small, the artifact handling and environment provisioning steps could be optimized. The key insight is that deployment optimization often requires both technical improvements and process changes to reduce manual steps.
08. Cross-stage optimization opportunities
After analyzing individual stages, cross-stage optimization opportunities become apparent. Common patterns include:
- Redundant operations across stages
- Inefficient data passing between stages
- Overlapping resource requirements
For example, a pipeline might show:
- Redundant dependency checks: 20% of total pipeline time
- Inefficient artifact passing: 15% of total pipeline time
- Overlapping resource usage: 10% of total pipeline time
This indicates that cross-stage optimization could potentially reduce pipeline time by 45 seconds. The key insight is that cross-stage optimization often reveals inefficiencies that aren't apparent when examining stages in isolation.
09. Tool selection considerations
Tool selection should consider:
- Native parallelization capabilities
- Integration with existing systems
- Cost of implementation
For example, GitHub Actions offers native parallel job execution, while Jenkins requires plugins. GitLab CI/CD provides built-in artifact management, while CircleCI requires additional configuration. The key insight is that tool selection should be based on specific requirements rather than general preferences.
The final step is implementing and validating optimizations.
10. Implementation and validation
Optimization implementation should follow:
- Small, incremental changes
- Continuous validation
- Rollback capability
For example, implementing parallel test execution might show:
- Initial reduction: 20% in test execution time
- Validation period: 2 weeks
- Rollback threshold: 5% increase in failure rate
This indicates that the optimization is successful if test execution time is reduced by 20% without increasing failure rates. The key insight is that optimization implementation requires careful planning and continuous monitoring.
Conclusion
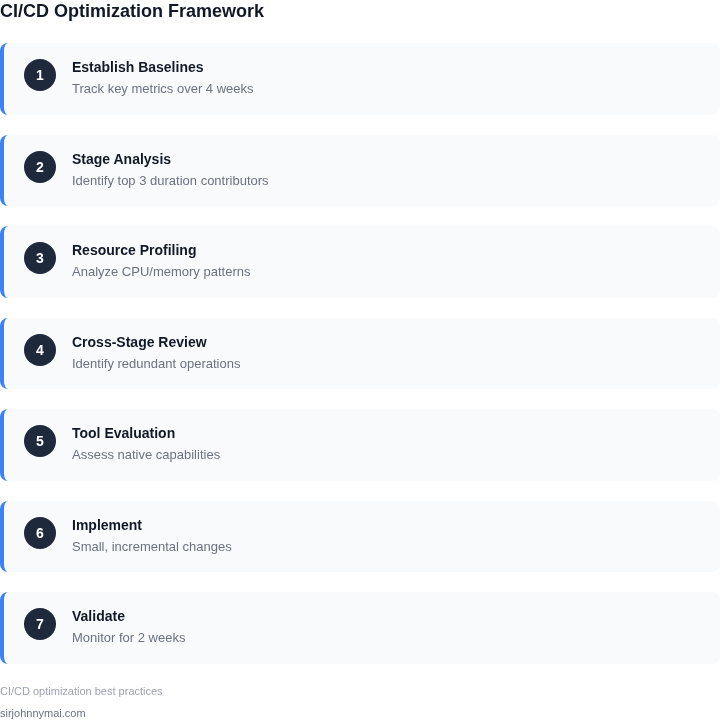
Slow CI/CD pipelines are a complex problem with multi-factorial causes. The systematic approach outlined here provides a framework for diagnosing and addressing these bottlenecks. The key takeaway is that optimization requires both technical improvements and process changes. The first step is establishing clear performance baselines, followed by stage-level analysis, resource utilization patterns, and cross-stage optimization opportunities.
Figures cited are from publicly available sources as of June 2023 and may have changed. The next specific step is to implement parallel test execution as the first optimization, with a focus on reducing test execution time by 20% while maintaining or improving failure rates.