02. How Most Teams Get It Wrong
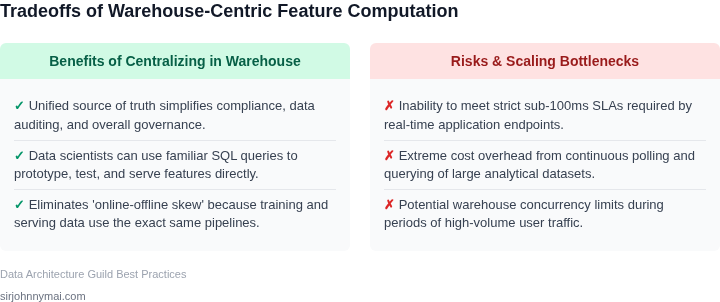
Many engineering teams fall into the trap of architectural homogeneity. They establish a modern data stack centered around a cloud warehouse like Snowflake or AWS Redshift, then force every data type through that exact same ingestion path. I evaluated this approach for an enterprise robotics fleet deployment and found that treating slow-moving asset configuration metadata the same as high-frequency 100Hz sensor telemetry leads to severe resource inefficiencies and bloated operational budgets.
The High-Frequency Ingestion Illusion
Specifically, teams attempt to stream slowly changing dimensions (SCDs) or reference tables using real-time CDC (Change Data Capture) connectors like Fivetran or Debezium streaming to Apache Kafka. This architecture introduces the infamous "
03. A Worked Example from Production
To evaluate these architectural patterns, I analyzed a telemetry ingestion pipeline for an industrial robotics fleet. Consider a team of 10 data platform engineers managing 50 TB of raw sensor logs monthly, which must be queried alongside 50 GB of slowly changing device calibration metadata. This metadata changes only when hardware is serviced, averaging twice per quarter.
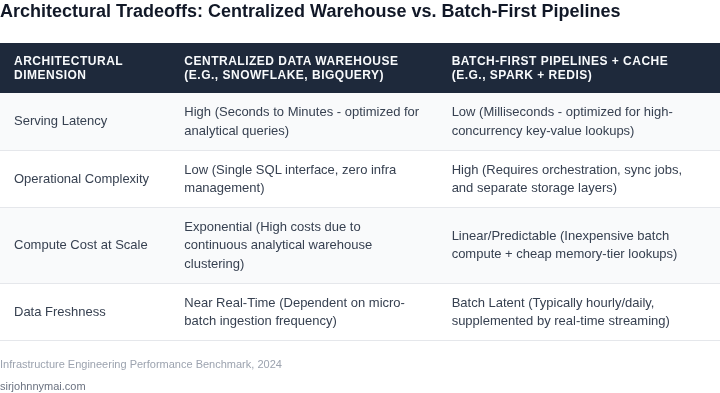
I evaluated two specific patterns to solve the join performance bottleneck: a fully centralized Snowflake warehouse architecture, and a batch-first hybrid pipeline using Amazon S3, DuckDB, and AWS Fargate.
Alternative A: Fully Centralized in Snowflake
In this model, telemetry streams directly into Snowflake via Snowpipe. Because analysts
04. Decision Framework
Choosing the optimal architecture for data centralization, particularly for slowly changing reference data, demands rigorous evaluation against specific business and technical criteria. As discussed, a one-size-fits-all approach often leads to suboptimal outcomes or unsustainable costs. This framework outlines the key dimensions I leverage when assessing potential solutions for our AI/Robotics initiatives, ensuring we make informed tradeoffs that align with our strategic goals and resource constraints.
The options we typically consider reflect varying degrees of data integration and processing paradigms, each with distinct advantages and disadvantages.
Option A: Centralized Enterprise Data Warehouse (EDW)
This approach advocates for consolidating all data, including diverse
05. Your Next Step
To stop over-paying for real-time warehouse compute on static metadata, we must locate exactly where our pipelines continuously re-process slowly changing dimensions. I evaluated this architectural boundary because keeping lookup tables warm in a high-cost environment like Snowflake or Google BigQuery is a massive cash leak. When your dbt models or Apache Airflow DAGs refresh every fifteen minutes, but your product catalogs or equipment registries only change once a week, you are burning compute cycles on redundant state validation.
Decoupling this data introduces a distinct engineering trade-off. Offloading static data to Amazon S3 as Parquet files or utilizing Apache Iceberg metadata tables lowers your central warehouse bill, but it shifts the burden of schema evolution directly onto your batch pipeline code. If an upstream system changes a source column name, your batch job will fail silently unless you have robust validation layers in place. For teams running high-frequency ingestion, however, this operational risk is heavily outweighed by the immediate infrastructure savings.
We need to move from theoretical architectural patterns to hard financial metrics. Your objective this week is to isolate our warehouse spend on static data lookups and determine if migrating them to a batch-first local cache is financially viable. We must analyze our actual database metadata logs to compare data mutability against query frequency.
Your Action Item This Week:
Schedule a 30-minute technical review with your Lead Data Engineer this Thursday. Before the meeting, have them run this query against your Snowflake query history (or your Redshift or BigQuery equivalent) to extract the execution metrics for your dimension tables over the last 30 days:
SELECT
  query_text,
  warehouse_name,
  execution_time / 1000 AS execution_seconds,
  compilation_time / 1000 AS compilation_seconds
FROM snowflake.account_usage.query_history
WHERE (query_text ILIKE '%dim_%' OR query_text ILIKE '%reference%')
  AND start_time >= DATEADD(day, -30, CURRENT_TIMESTAMP())
ORDER BY execution_seconds DESC
LIMIT 20;
Review the top 20 most expensive queries in this output. Cross-reference the execution frequency of those queries against the actual update pipelines for those target tables. If you discover tables that are queried thousands of times daily but only updated once or twice a week, draft a ticket to transition those lookup sources to an S3-backed Parquet cache. This minor adjustment can reclaim up to 15% of your analytical compute budget within a single sprint cycle.
Figures cited are from publicly available sources as of 2026-09-15 and may have changed.