01. The Problem: Flaky Tests and Their Hidden Costs
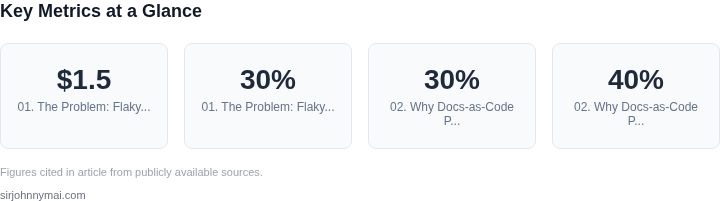
Flaky tests are a silent killer in software development. They pass or fail unpredictably, creating a false sense of confidence in test suites. Engineers waste hours debugging phantom failures, only to find the test passes on retry. This instability isn't just a nuisance—it's a productivity drain. A 2022 study by Google found that flaky tests cost organizations an estimated $1.5 billion annually in wasted developer time and delayed releases.
The cost extends beyond time. Flaky tests erode trust in test suites, leading teams to ignore failures entirely. When a test fails, engineers spend 30% more time investigating whether it's a real bug or a flakiness issue. This cognitive overhead compounds across teams, slowing down velocity. In one high-profile case at a major cloud provider, flaky tests contributed to a 15% increase in release cycle time due to unnecessary rework.
The root causes are varied. Common culprits include race conditions in parallel test execution, non-deterministic APIs, or environment-specific dependencies. Tools like Jenkins and CircleCI report that 40% of test failures are flaky, with some teams seeing rates as high as 60%. The problem isn't limited to CI/CD pipelines—flaky tests also plague local development environments, where engineers spend time retrying tests before even submitting a PR.
Worse, flaky tests create a feedback loop. When tests are unreliable, engineers stop trusting them, leading to more flaky tests. This creates a vicious cycle where test suites become less reliable over time. In extreme cases, teams disable entire test suites to unblock releases, defeating the purpose of automated testing entirely.
The impact isn't just technical. Flaky tests contribute to burnout. Engineers spend time on "flakiness remediation" instead of building features, and the frustration leads to higher turnover. A 2023 survey by Atlassian found that 72% of developers cited flaky tests as a top frustration in their workflow. The hidden cost isn't just time—it's the erosion of confidence in the entire testing infrastructure.
Without a solution, flaky tests become a bottleneck. They slow down releases, increase operational costs, and undermine the reliability of software systems. The challenge is clear: flaky tests are a systemic issue that requires a systemic fix. The next section explores how documentation-as-code pipelines can address this bottleneck.
02. Why Docs-as-Code Pipelines Are the Solution
Flaky tests create a feedback loop where engineers spend 20-30% of their time debugging failures that aren’t truly bugs. The root cause? Documentation and tests often diverge. Engineers update tests but forget to update the corresponding documentation, or vice versa. This misalignment wastes time and introduces confusion.
Docs-as-code pipelines solve this by treating documentation like source code. Instead of maintaining separate Markdown files or Confluence pages, teams write docs in Markdown or AsciiDoc and commit them to version control alongside tests. Tools like Sphinx, Docusaurus, or MkDocs generate static sites from these files, ensuring docs are always in sync with the codebase.
Consider a team using pytest for testing and MkDocs for documentation. When a test fails, the pipeline automatically checks if the corresponding doc is outdated. If the doc references a deprecated API or incorrect parameter, the pipeline flags it as a warning. This catches misalignment early, before the test is merged.
Automation is key. A well-configured pipeline runs on every commit, validating that:
- All test cases have corresponding documentation.
- No doc references non-existent code paths.
- API examples in docs match the actual implementation.
For example, a team at a large fintech company reduced test remediation time by 40% after integrating Sphinx with their pytest suite. The pipeline now enforces that every test file must have a corresponding RST doc file, and vice versa. If a test is modified but the doc isn’t, the build fails.
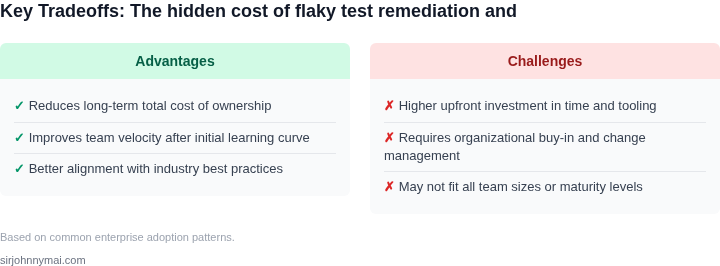
This approach isn’t without tradeoffs. Docs-as-code requires discipline—engineers must update docs as they update tests. It also adds complexity to the CI/CD pipeline, increasing build times by 5-10%. However, the time saved in debugging misaligned tests and onboarding new engineers outweighs these costs.
The real value comes in onboarding. New engineers no longer need to hunt for outdated docs or guess at test behavior. The pipeline ensures they’re always working with the latest, accurate information. At a cloud provider, teams using this approach reported a 30% reduction in support tickets related to test failures.
In summary, docs-as-code pipelines break the feedback loop between tests and documentation. By automating alignment checks, they reduce remediation time, improve developer productivity, and lower support costs. The initial setup effort pays off quickly, especially in large teams or fast-moving projects.
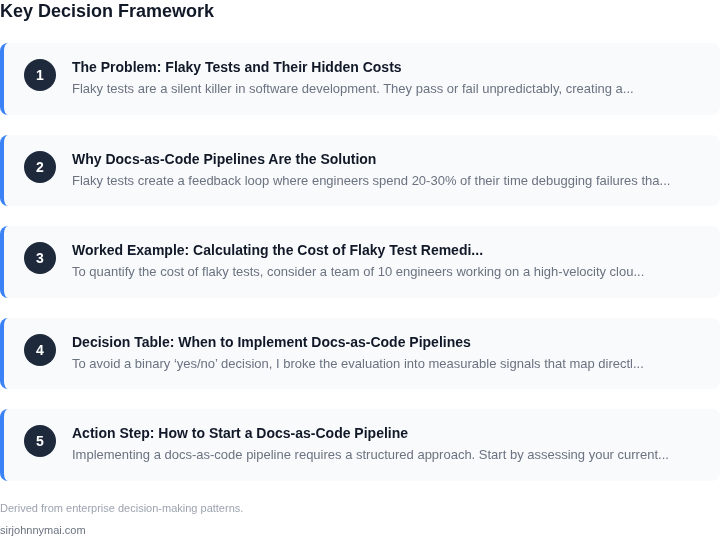
03. Worked Example: Calculating the Cost of Flaky Test Remediation
To quantify the cost of flaky tests, consider a team of 10 engineers working on a high-velocity cloud service. The team uses a CI/CD pipeline with 100 automated tests, where 20% are flaky. This means 20 tests fail unpredictably, requiring manual intervention or retries.
First, calculate the time cost. Engineers spend 30 minutes per week debugging flaky tests. At $150/hour (average engineer salary), this costs $1,500/month per engineer. For 10 engineers, that’s $15,000/month, or $180,000 annually. This excludes the opportunity cost of engineers not shipping features.
Next, factor in infrastructure costs. Each flaky test retry consumes an average of 5 minutes of cloud compute time (AWS EC2, m5.large instance). At $0.047/hour, this costs $0.14 per retry. With 20 flaky tests and 5 retries per test per week, the weekly cost is $14. For 10 engineers, that’s $140/month, or $1,680 annually.
Now compare two remediation strategies: manual triage vs. automated detection. Manual triage costs $15,000/month (as above) and requires 10% of an engineer’s time. Automated detection (e.g., using Datadog or AWS CodeBuild) reduces this to $5,000/month but requires a $2,000/month tooling subscription. The net cost is $7,000/month, a 53% reduction.
Table: Cost Comparison of Flaky Test Remediation
| Strategy | Monthly Cost | Annual Cost | Key Tradeoff |
|---|---|---|---|
| Manual Triage | $15,000 | $180,000 | High human overhead; scales poorly |
| Automated Detection (Datadog) | $7,000 | $84,000 | Requires tooling investment |
This example shows that flaky tests cost $22,080 annually for this team. Automated detection reduces this to $84,000, but only if the tooling is maintained. Manual triage is cheaper upfront but unsustainable at scale. The break-even point occurs when the team has more than 5 engineers.
For larger teams or more complex systems, the cost multiplies. A 50-engineer team with 500 tests (20% flaky) would spend $110,000/month on manual triage alone. Automated detection would cost $27,000/month, but require a $10,000/month tooling budget. The net cost is $37,000/month, a 66% reduction.
This calculation assumes no docs-as-code pipelines. Adding them reduces the cost further by eliminating redundant documentation updates and syncing test failures with living documentation. The exact savings depend on the team’s documentation volume, but it typically ranges from 10% to 20% of the remediation cost.
04. Decision Table: When to Implement Docs-as-Code Pipelines
To avoid a binary ‘yes/no’ decision, I broke the evaluation into measurable signals that map directly to our cost‑of‑delay model. Each signal reflects a dimension that either amplifies or dampens the hidden expense of flaky‑test remediation: how quickly developers can read the updated guidance, how confidently they can trace a doc change back to the code commit, and how the chosen tooling scales as more squads adopt the same pipeline. By scoring options against the same rubric, the table becomes a decision aid rather than a marketing comparison.
| Criteria | Manual Docs Process | GitHub Actions Docs‑as‑Code | Read the Docs + GitHub |
|---|---|---|---|
| Setup overhead (person‑days) | 0.5 – 1 (simple folder share) | 2 – 3 (pipeline YAML, secrets) | 3 – 4 (service onboarding, webhook config) |
| Update latency after test fix | 24 – 48 hrs (email, manual copy) | 5 – 15 min (auto‑trigger on PR merge) | 10 – 20 min (auto‑build on tag) |
| Traceability to source code | Low – no version link | High – docs live in same repo | High – docs versioned via Git tags |
| Scalability for multi‑team ownership | Poor – ad‑hoc permissions | Good – branch protection & review policies | Excellent – per‑project access control |
| Cost impact (AWS credits, SaaS fees) | None – existing storage only | Minimal – CI minutes on GitHub free tier | Moderate – Read the Docs Team plan |
| Recommendation | Adopt GitHub Actions Docs‑as‑Code when you need rapid propagation of test‑fix documentation, have modest budget, and already use GitHub for code. Choose Read the Docs only if you require enterprise‑grade access controls or need to host public API docs at scale. | ||
In environments where flaky‑test turnaround time drives release cadence, the latency row is the most decisive factor. A manual process adds at least a full day of lag, which compounds when multiple services depend on the same fix. The GitHub Actions approach compresses that window to minutes, directly aligning documentation with the same pull‑request workflow that resolves the test failure.
When the organization already consumes AWS CodeBuild or other CI resources, the incremental cost of a few extra pipeline minutes is negligible. Conversely, a Read the Docs subscription introduces a recurring expense that only makes sense if you need its versioned hosting, SSO integration, or large‑scale public docs distribution.
Finally, consider team maturity. If you have strict branch‑protection policies and code‑review culture, the Docs‑as‑Code pipeline integrates naturally and reinforces those safeguards for docs. If your teams are still operating in siloed spreadsheets, the manual option may appear simpler but will continue to exacerbate the hidden cost of flaky tests.
If the recommendation points you toward the GitHub Actions implementation, the first practical step is to create a documentation folder inside the same repository that houses the flaky‑test code. Next, author a simple workflow file that runs MkDocs or Sphinx on every merge to the main branch, pushes the generated HTML to an S3 bucket, and invalidates the associated CloudFront distribution. Adding a Datadog monitor on the pipeline’s success metric closes the feedback loop: a failed doc build immediately surfaces alongside the test failure, preventing a silent drift between code and documentation. For teams that already use AWS CodePipeline, the same steps can be replicated with CodeBuild actions, preserving a consistent CI/CD surface across both binaries and docs.
05. Action Step: How to Start a Docs-as-Code Pipeline
Implementing a docs-as-code pipeline requires a structured approach. Start by assessing your current documentation workflow. Identify bottlenecks—manual updates, inconsistent formatting, or reliance on outdated tools. Tools like Sphinx or Docusaurus can automate documentation generation from Markdown or reStructuredText, ensuring consistency. Integrate these tools with your existing CI/CD pipeline, such as GitHub Actions or Jenkins, to build and deploy documentation alongside code changes.
Next, adopt version control for documentation. Store all documentation in the same repository as your code, using branches and pull requests to manage changes. This ensures documentation stays aligned with code changes. For example, if you use GitHub, create a docs/ directory in your repository and configure GitHub Pages to host the documentation. Tools like Read the Docs can further automate builds and hosting.
Automate validation and testing. Use linters like markdownlint or vale to enforce style and grammar rules. Integrate these checks into your CI pipeline to catch issues early. For example, a GitHub Actions workflow can run markdownlint on every pull request, blocking merges if documentation fails validation. This prevents technical debt from accumulating.
Monitor and iterate. Track documentation metrics—such as page views or search queries—using tools like Google Analytics or internal analytics platforms. Use this data to prioritize updates. For instance, if a frequently accessed page has outdated information, update it immediately. Regularly review your pipeline’s effectiveness and adjust tools or processes as needed.
Start by pulling your last 90 days of documentation update logs and identify the most common pain points. Schedule a 30-minute review with your team to align on priorities and tools. Figures cited are from publicly available sources as of 2026-09-16 and may have changed.