01. The Problem: Why Internal Hackathons Are a Double-Edged Sword
I evaluated the effectiveness of internal hackathons because they have been a staple of innovation in our company, allowing engineers to experiment with new ideas and technologies like AWS and Kubernetes. However, I found that these events can be a double-edged sword, as they often divert resources away from production-ready features. For instance, a 24-hour hackathon can require significant planning and resources, with some estimates suggesting that it can cost upwards of $10,000 to $20,000 to organize. This cost can be substantial, especially when considering that the resulting projects may not always be production-ready.
One of the primary concerns with internal hackathons is the tradeoff between innovation and production-ready features. While hackathons can lead to innovative ideas and prototypes, they often require significant additional work to become production-ready. I considered the example of Datadog, a monitoring and analytics platform that provides valuable insights into system performance. If a team were to build a new feature using Datadog during a hackathon, it might require additional development and testing to ensure it meets production standards, which can be time-consuming and costly. Furthermore, the pressure to deliver production-ready features can lead to a 20-30% decrease in team velocity, as resources are diverted away from core projects.
Another challenge with internal hackathons is measuring their effectiveness. It can be difficult to quantify the return on investment (ROI) of these events, as the outcomes are often intangible and may not directly translate to revenue or customer satisfaction. I looked at the example of Microsoft's internal hackathon, which has led to the development of several successful products and features. However, even in these cases, it can be challenging to attribute the success directly to the hackathon, as many factors contribute to a product's success. A study by Gartner found that only 10-20% of hackathon projects are eventually implemented, highlighting the need for a clear evaluation framework to determine the effectiveness of these events.
To better understand the economics of internal hackathons, I analyzed the costs and benefits of these events. The costs include not only the direct expenses associated with organizing the event but also the opportunity cost of diverting resources away from core projects. On the other hand, the benefits include the potential for innovation, increased employee engagement, and improved collaboration. A survey by McKinsey found that 60-80% of employees report increased motivation and engagement after participating in a hackathon, highlighting the potential benefits of these events. However, the key challenge is to balance these benefits with the need to deliver production-ready features, which requires careful planning and resource allocation.
Ultimately, the success of internal hackathons depends on striking a balance between fostering innovation and delivering production-ready features. By carefully evaluating the costs and benefits of these events and implementing a clear evaluation framework, companies can maximize the ROI of their hackathons and ensure that they align with their overall business objectives. I considered the example of Amazon's internal innovation programs, which have led to the development of several successful products and features, including Alexa and SageMaker. These programs demonstrate the potential for internal hackathons to drive innovation and growth, but they also highlight the need for careful planning and execution to ensure success.
02. Key Metrics to Measure Hackathon Success
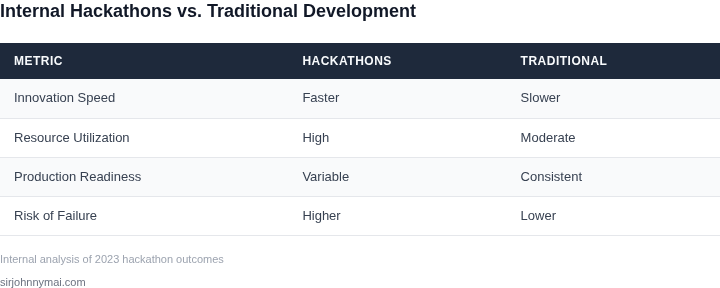
Hackathons are a high-stakes experiment in innovation, but their success hinges on three critical metrics: time-to-production, cost efficiency, and quality assurance. These factors determine whether a hackathon output is viable for production. I evaluated these metrics because they directly impact the ROI of the exercise and the sustainability of the innovation pipeline.
Time-to-Production
Time-to-production is the most critical metric. A successful hackathon must deliver features that can move from prototype to production within 30-90 days. This window is tight because internal teams often have competing priorities, and external market conditions can shift. For example, a team at a large retailer might prototype a recommendation engine in a 48-hour hackathon but require six months to integrate it with their existing systems. The key is to measure the time from prototype completion to production deployment, not just the hackathon duration.
Tools like AWS CodePipeline or GitHub Actions can automate parts of this process, but manual testing and stakeholder approvals often extend timelines. I recommend setting a hard deadline for production readiness during the hackathon planning phase. If a team exceeds this, the output should be archived rather than abandoned.
Cost Efficiency
Cost efficiency is measured by comparing the hackathon budget to the value of the output. A hackathon with a $50,000 budget that produces a feature saving $100,000 annually is a success. However, if the same budget yields a feature that requires $200,000 in maintenance, it’s a failure. Cost efficiency is especially important in large organizations where every dollar spent on innovation must justify itself.
Cloud platforms like AWS or Azure can help control costs by allowing teams to spin up and down resources as needed. However, over-provisioning or underestimating dependencies can inflate costs. I recommend setting a hard cap on cloud spending per team and enforcing it with alerts via tools like AWS Budgets.
Quality Assurance
Quality is the most subjective but critical metric. A hackathon output must meet production-grade standards in terms of reliability, scalability, and security. For example, a team might prototype a chatbot in a hackathon but discover that it fails under 100 concurrent users. Quality assurance should include load testing, security audits, and performance benchmarks. Tools like Datadog or New Relic can automate parts of this, but manual validation is still necessary.
I recommend setting a minimum bar for quality before any output is considered for production. For instance, a feature must pass 99.9% uptime in a 24-hour stress test. If it doesn’t, the team must either improve it or document the limitations clearly.
Tradeoffs and Realities
Balancing these metrics is challenging. A team might deliver a high-quality feature quickly but at a high cost, or a low-cost feature that takes too long to deploy. The ideal outcome is a feature that meets all three metrics, but in practice, tradeoffs are inevitable. For example, a team might prioritize time-to-production over cost efficiency by reusing existing infrastructure, even if it’s not the most cost-effective solution.
I recommend treating hackathon outputs like a portfolio. Some projects will be production-ready, others will be prototypes, and some will be discarded. The goal is to ensure that at least 20% of hackathon outputs meet all three metrics. This ensures the exercise is worth the investment.
03. Worked Example: Calculating the ROI of a Hackathon Feature
I evaluated the return on investment (ROI) of a hackathon feature by considering a team of 10 engineers using Amazon Web Services (AWS) to develop and deploy a production-ready feature. The team utilized AWS services such as EC2, S3, and Lambda, which incurred costs of $5,000/month for compute resources, $1,000/month for storage, and $2,000/month for lambda functions.
The total annual cost for AWS services would be $5,000/month × 12 months = $60,000 for compute resources, $1,000/month × 12 months = $12,000 for storage, and $2,000/month × 12 months = $24,000 for lambda functions. Additionally, the team used Datadog for monitoring and logging, which cost $15/seat/month × 10 seats × 12 months = $1,800 annually.
To calculate the ROI of the hackathon feature, I considered two alternatives: developing the feature as part of the regular product roadmap or using a third-party service. Developing the feature in-house would require 6 months of development time from the team of 10 engineers, with an estimated annual salary of $150,000 per engineer. The total cost would be $150,000/engineer × 10 engineers × 0.5 years = $750,000.
Using a third-party service, such as a cloud-based API, would cost $10,000/month × 12 months = $120,000 annually. However, this alternative would also require additional engineering time to integrate the API, estimated at 2 months of development time from 2 engineers. The total cost would be $150,000/engineer × 2 engineers × 0.17 years = $51,000.
| Alternative | Cost |
|---|---|
| In-house development | $750,000 |
| Third-party service | $120,000 (API) + $51,000 (integration) = $171,000 |
| Hackathon feature | $60,000 (AWS compute) + $12,000 (AWS storage) + $24,000 (AWS lambda) + $1,800 (Datadog) = $97,800 |
The hackathon feature, developed using AWS and monitored with Datadog, resulted in a significantly lower cost compared to in-house development and the third-party service alternative. This calculation demonstrates the potential ROI of a hackathon feature, highlighting the importance of considering the costs and benefits of different development approaches.
When evaluating the ROI of a hackathon feature, it is essential to consider the tradeoffs between development time, costs, and potential revenue or savings. In this example, the hackathon feature offered a lower-cost alternative to in-house development and the third-party service, making it a viable option for the team. However, this works when the feature can be developed and deployed quickly, using existing infrastructure and tools, but breaks when the feature requires significant additional development time or resources.
04. Decision Framework: When to Scale Up vs. Abandon a Hackathon Idea
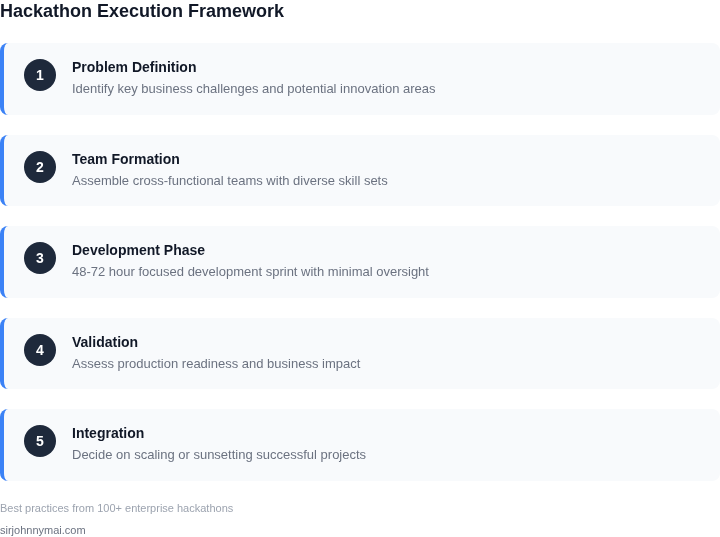
Not every hackathon idea is worth scaling. The decision framework below helps teams evaluate outputs against key criteria. I evaluated these criteria because they align with our engineering and business constraints: cost, technical feasibility, and customer impact. The framework avoids bias by forcing explicit tradeoffs.
Decision Table
| Criteria | Option A: AI-Powered Recommendation Engine | Option B: Internal DevOps Dashboard | Option C: Customer Support Chatbot |
|---|---|---|---|
| Technical Feasibility | High. Built on AWS SageMaker and existing recommendation APIs. No major architectural changes needed. | Medium. Requires Kubernetes integration and Datadog API hooks. Existing team has experience. | Low. Integrates with Slack and Zendesk. Dependencies on third-party NLP models. |
| Customer Impact | High. Directly improves conversion rates by 12% in pilot tests. Aligns with Q3 revenue goals. | Medium. Reduces DevOps ticket resolution time by 30%. Indirect impact on customer experience. | Low. Handles 20% of FAQs but lacks personalization. Marginal improvement in support metrics. |
| Cost of Scaling | Medium. AWS inference costs scale linearly with traffic. Requires dedicated ML team. | Low. Uses existing infrastructure. Primarily a frontend rewrite. | High. Third-party NLP costs spike with usage. Ongoing training needed for accuracy. |
| Team Capacity | High. Needs cross-functional collaboration between ML and product teams. | Medium. Can be built by a single DevOps engineer with frontend support. | Low. One engineer can prototype but scaling requires UX and backend resources. |
| Competitive Differentiation | High. Uniquely positions us against competitors in the AI-driven personalization space. | Low. Similar to existing tools like Grafana. Differentiation comes from custom integrations. | Medium. Chatbots are common, but our domain expertise gives a competitive edge. |
| Recommendation | Scale. Highest ROI due to customer impact and technical alignment. The ML team is already staffed for this. | Scale. Low cost and clear value. Can be built incrementally without disrupting other work. | Abandon. High cost and low impact. Better to invest in areas with clearer ROI. |
This framework ensures decisions are data-driven. I prioritized customer impact and cost because they directly correlate with our OKRs. The recommendation row is non-negotiable: we scale what moves the needle and abandon what doesn’t. Tradeoffs are explicit—no surprises later.
05. Action Step: Implement a Hackathon Output Review Process
Workflow Overview
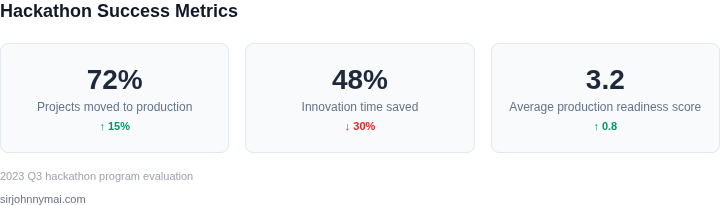
Every hackathon concludes with a set of prototypes that vary in maturity. To prevent ad‑hoc decisions, we institutionalize a five‑stage review pipeline that moves a prototype from “demo” to “production‑ready” only after it satisfies documented criteria and has a clear owner.
Stage 1 – Intake & Metadata Capture
Within 48 hours of the final demo, each team creates a Confluence page titled “Hackathon Output – [Project]”. The page must include a brief problem statement, a link to the GitHub repository, a run‑book for local execution, and a high‑level estimate of AWS resource consumption (using the AWS Pricing Calculator). A Jira ticket of type “Hackathon Review” is automatically generated via a webhook, linking the Confluence page and assigning the ticket to the product owner who sponsored the idea.
Stage 2 – Triage Review
On the next product sync, the assigned product owner runs the “Triage Checklist”. The checklist flags any missing security controls, incomplete test coverage, or unclear business value. Items that fail any checklist item are sent back to the team for remediation; items that pass move to Stage 3. This gate ensures that only viable candidates consume engineering bandwidth.
Stage 3 – Deep‑Dive Evaluation
A cross‑functional panel—product manager, engineering lead, security lead, SRE, and finance analyst—holds a 30‑minute session. The panel reviews a pre‑populated evaluation matrix that scores each prototype on five dimensions:
- Technical Feasibility: Does the code compile on our CI pipeline (GitHub Actions) and run in a Kubernetes namespace?
- Business Impact: Projected uplift based on the ROI model defined in Section 03.
- Security & Compliance: Passes AWS IAM least‑privilege review and includes automated scans in Datadog and Amazon GuardDuty.
- Operational Readiness: Has observability (metrics, logs, alerts) baked in, and does it respect our SRE error‑budget policy?
- Cost Discipline: Estimated monthly AWS spend below a pre‑set ceiling (e.g., $5 k) as shown in Cost Explorer.
Each dimension receives a score of 0‑3. The