01. The Hidden Drain of Static Staging Environments
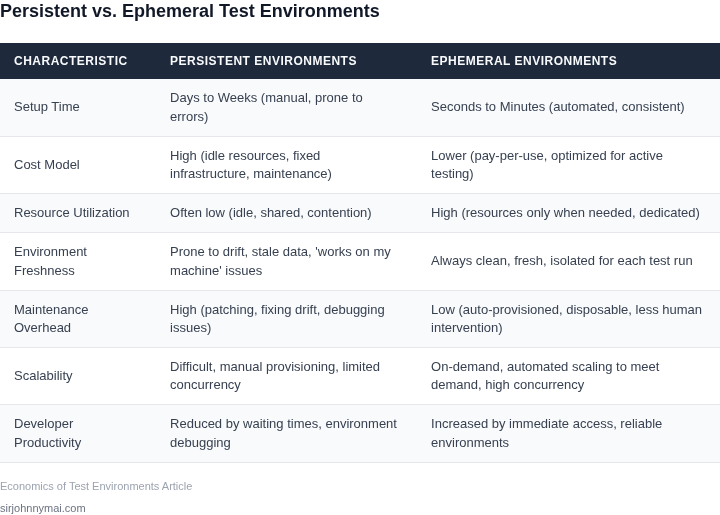
Static staging environments were once the standard approach, offering a consistent place to validate changes before production deployment. The intent was sound: provide a stable, long-lived replica of production to catch integration issues and functional regressions. However, our operational experience indicates this approach silently erodes engineering efficiency and inflates infrastructure costs over time.
One of the most insidious issues is environment drift. Over months or years, a static staging environment inevitably deviates from production due to manual configuration changes, patched hotfixes, or simply different deployment cadences for various microservices. This divergence means tests run in staging often fail to replicate production behavior, leading to false positives or, worse, critical bugs appearing only after production deployment. We've seen instances where specific AWS Lambda function versions or Amazon RDS parameter groups differed, leading to unexpected runtime errors that were only caught post-deployment.
These environments are typically provisioned to run 24/7, incurring continuous costs for compute (e.g., AWS EC2 instances, Amazon ECS Fargate tasks), databases (e.g., Amazon RDS), and networking components. Our analysis frequently shows these resources are significantly underutilized, perhaps active for only 40-50% of typical business hours and near-zero outside of them. For an organization maintaining five distinct static staging environments, each costing approximately $5,000 per month in AWS resources, this translates to $300,000 annually, with a substantial portion of that expenditure being for idle capacity. This constant burn contributes to a high total cost of ownership without proportional value.
The scarcity of static staging environments also creates significant bottlenecks for engineering teams. With only one or a few shared environments, multiple feature teams often contend for deployment slots, forcing them to queue up their changes. This contention can delay feature testing by hours or even days, especially in larger organizations with dozens of active feature branches. Engineers spend valuable time coordinating deployments or waiting for previous tests to complete, rather than focusing on development. This often manifests as CI/CD pipelines becoming blocked at the deployment-to-staging phase, eroding the benefits of automated builds and tests.
Furthermore, these environments demand ongoing operational overhead. Teams dedicate significant time to debugging environment-specific issues, reconciling configuration discrepancies, and manually refreshing data. This maintenance effort diverts skilled engineers from developing new features or improving existing products. The effort to manually sync data, troubleshoot network ACLs, or update application secrets across these environments represents a substantial, often unaccounted for, drag on engineering velocity. For a team of 10 engineers, even 5% of their collective time spent on environment-related issues translates to half an engineer-month lost per month, a tangible impact on product delivery timelines.
These accumulating pressures—drift, underutilized resources, deployment queues, and operational overhead—silently but significantly inflate engineering budgets and hinder our ability to deliver features rapidly. Recognizing these pervasive drains is the first step toward exploring more efficient paradigms.
02. Analyzing the Total Cost of Ownership (TCO) of Test Environments
Evaluating a shift from traditional static staging to ephemeral environments necessitates a rigorous TCO analysis. This goes beyond immediate infrastructure expenses, encompassing the full lifecycle costs and their impact on engineering velocity. For our AI/Robotics division, where iteration speed is paramount, understanding these hidden costs is crucial for justifying a platform investment. I've identified three primary cost drivers that often accumulate unrecognized debt in static environments. First, direct infrastructure spend includes the provisioned compute, storage, and networking resources across all stages—development, staging, and pre-production. This covers AWS EC2 instances, RDS databases, S3 buckets for artifact storage, and the associated data transfer costs. Furthermore, licenses for APM tools like Datadog or observability platforms can add up, even if resources are underutilized for extended periods in static setups. Second, maintenance labor represents a significant, often underestimated, cost. This includes the engineering hours dedicated to environment provisioning, dependency management, patching operating systems, and database synchronization. Our SRE and platform teams spend considerable cycles debugging environment-specific issues, reconciling configuration drift, and manually refreshing data sets in static staging. This labor is a direct drain on resources that could otherwise be allocated to building new features or improving core platform stability. Third, and perhaps most impactful for our development velocity, is the cost of developer idle time. When engineers wait for environment availability, struggle with stale data, or contend with flaky tests due to shared resource contention, their productivity suffers. This translates into longer development cycles, delayed feature releases, and a higher cost per committed line of code. Quantifying this opportunity cost requires tracking blocked time and estimating its impact on our product roadmap. These delays directly affect our ability to innovate and respond to market demands with new robotic capabilities. To systematically evaluate the strategic options for our test environment infrastructure, I've constructed a decision framework. This table compares the TCO across different approaches, considering both direct and indirect cost implications. My goal here is to provide a clear, data-informed perspective that moves beyond anecdotal evidence of pain points to a structured financial assessment.| Criteria | Static Staging Environments | Custom Ephemeral Platform (e.g., Kubernetes + Argo CD) | Managed Ephemeral Platform (e.g., specialized PaaS) |
|---|---|---|---|
| Initial Setup Cost | Low (Leverages existing cloud patterns) | High (Significant engineering effort for platform build-out) | Moderate (Subscription costs, integration effort) |
| Ongoing Infrastructure Cost | Moderate-High (Persistent resources, potential for underutilization) | Low-Moderate (On-demand resource scaling, efficient utilization) | Moderate (Subscription plus minimal underlying cloud resources) |
| Maintenance Labor (FTEs/Hours) | High (Manual provisioning, debugging, data sync, configuration drift) | Moderate (Platform maintenance, but automated environment management) | Low (Vendor handles platform, internal teams manage integration/templates) |
| Developer Productivity Impact (Idle Time) | High Blockage (Environment contention, stale data, slow feedback) | Low Blockage (Self-service, fast provisioning, isolated testing) | Very Low Blockage (Fully abstracted, highly reliable, rapid cycles) |
| Scalability & Parallelism | Limited (Resource constraints, manual scaling) | High (Kubernetes-native scaling, dynamic resource allocation) | Very High (Designed for massive parallel environment creation) |
| Data Management Complexity | High (Manual refreshes, sensitive data concerns in shared environments) | Moderate (Automated data snapshotting/masking through platform) | Low (Integrated secure data handling, synthetic data options) |
| Security & Compliance Overhead | Moderate (Shared access, manual reviews, potential for configuration drift) | Moderate (Requires robust platform-level security, image scanning, policy enforcement) | Low (Vendor-managed compliance, secure by design, audit trails) |
| Recommendation for AI/Robotics | Avoid for new projects due to high hidden costs and velocity impact. | Consider for organizations with strong platform engineering capabilities and unique requirements. | Strong Recommendation for accelerating AI/Robotics development, balancing cost and speed. |
03. The Math of Idle Staging: A Worked ROI Calculation
Building on our analysis of Total Cost of Ownership, let's concretize these concepts with a direct financial comparison. I've modeled a common scenario for a product team, highlighting where the financial leverage truly lies. Consider a team of 20 software engineers developing and testing a microservices-based application. They currently rely on five long-lived, static staging environments for integration, QA, and pre-production testing.
Alternative 1: Five Static Environments
These environments operate 24/7, regardless of active usage. Each environment comprises a Kubernetes cluster running on AWS EC2, a dedicated RDS Aurora database, an ElastiCache instance, an Application Load Balancer, and associated storage and networking. We also factor in comprehensive monitoring via services like Datadog.
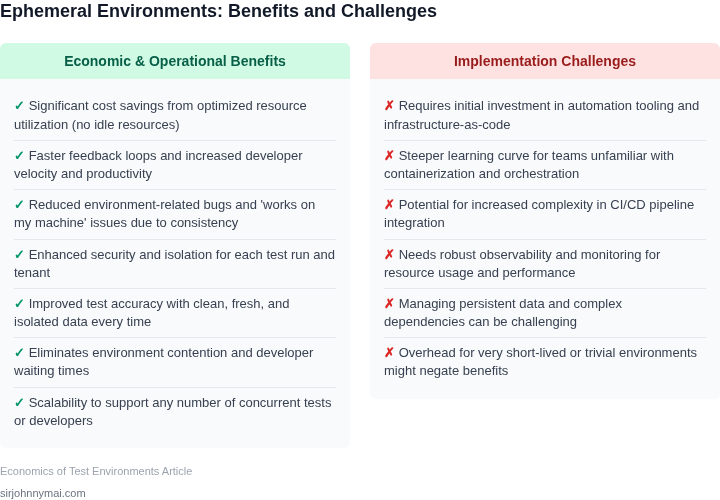
- Infrastructure Cost (5 Environments, 24/7): I evaluated each complex environment to cost approximately $2,500/month. This covers compute, database, caching, storage, and network egress. Total: $2,500/environment × 5 environments = $12,500/month.
04. The Threshold Matrix: When Do Ephemeral Environments Pay for Themselves?
Building on our analysis of Total Cost of Ownership and the ROI calculations from previous sections, the critical question becomes: *when* does the investment in migrating to ephemeral environments yield a positive return? This is not a universal answer. I've developed a threshold matrix to guide Product Managers in identifying this precise tipping point, mapping key organizational and technical factors to different adoption strategies. This framework moves beyond generalized benefits, focusing on tangible triggers within your specific context. The decision to transition requires a careful evaluation of current operational overhead, developer experience friction, and wasted cloud spend. The matrix below outlines criteria that, when met, indicate a strong economic case for adopting or fully embracing ephemeral environments. It also highlights scenarios where a more gradual or even a static approach might still be justifiable, minimizing unnecessary migration costs.| Criteria | Traditional Static Environments | Hybrid Ephemeral (Managed Container Services) | Advanced Ephemeral (Kubernetes & Environment Platforms) |
|---|---|---|---|
| Team Size & Development Velocity | Small teams (<10 developers), lower commit frequency, primarily sequential feature work. | Medium-sized teams (10-30 developers), moderate velocity, increasing demand for parallel testing. | Large, multiple teams (>30 developers), high velocity, extensive parallel feature development across many branches. |
| Deployment Frequency (per day) | Fewer than 1-2 deployments per shared staging environment. Manual releases are common. | 2-5 deployments per day, often targeting a mix of shared and temporary environments for review. | 5+ deployments per day per engineer or team. Each PR often requires its own isolated test environment. |
| Current Cloud Spend (Dev/Test) | Low to moderate, but with identified idle resource waste. Cost savings from ephemeral might be marginal initially. | Moderate to high, with significant waste from underutilized, long-lived staging environments. Clear potential for cost reduction. | Very high, substantial waste identified from numerous long-lived, full-stack environments. Ephemeral promises major, measurable savings. |
| Environment Provisioning Time | Days to weeks for a new, stable, and isolated environment. High manual effort involved. | Hours for a new environment, often semi-automated via scripts leveraging services like AWS Fargate or Azure Container Apps. | Minutes for a fully functional, isolated environment, highly automated via self-service platforms (e.g., using Kubernetes with Loft.sh or Garden.io). |
| Concurrent Feature Branches | Fewer than 5 active branches. Reliance on feature flags or sequential testing for integration. | 5-15 active branches. Occasional conflicts require manual coordination or dedicated, short-lived integration environments. | 15+ active branches. Each requires its own isolated, ephemeral environment to avoid conflicts and enable rapid, independent testing. |
| Recommendation | Maintain current approach if ROI for transition is negative. Focus on optimizing existing static environments for cost efficiency. | Pilot ephemeral environments for specific teams or projects. Leverage managed container services for simpler adoption. Evaluate incremental ROI. | Invest in a full platform shift. Prioritize tools that deeply integrate with CI/CD and provide robust self-service for developers. Maximize cost savings and velocity. |
This matrix provides a structured approach to evaluate your current state against the benefits of ephemeral environments. The optimal choice depends on balancing the immediate costs of migrating versus the long-term gains in agility, developer productivity, and reduced TCO. For many organizations, the "Hybrid Ephemeral" approach serves as a valuable stepping stone, allowing for incremental adoption and proving value before a full platform commitment. Regular re-evaluation against these criteria is crucial as your team, product, and cloud infrastructure needs evolve.
05. Your Phase-One Ephemeral Migration Plan
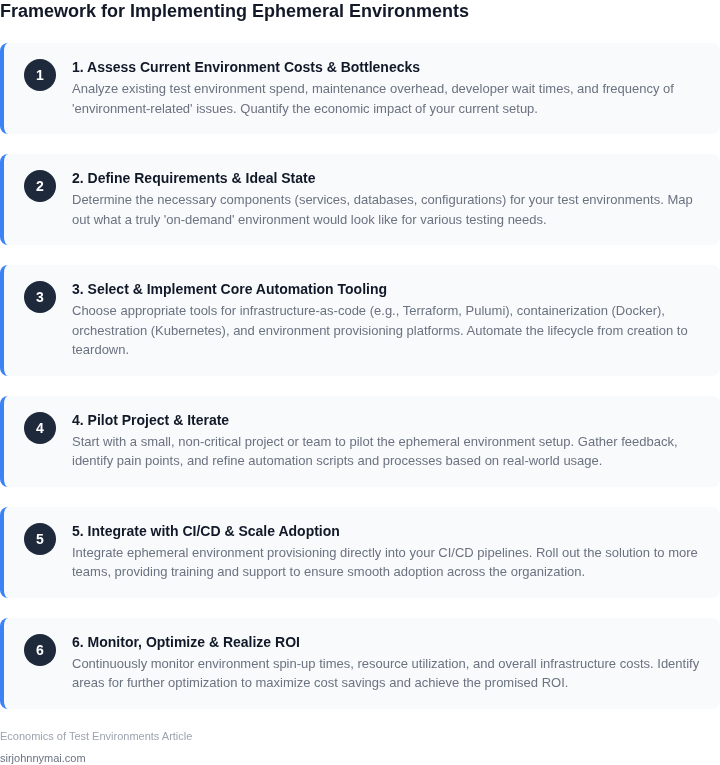
Migrating straight to a fully dynamic, containerized ephemeral architecture requires substantial platform engineering overhead. I evaluated this transition at scale and found that immediate, overnight shifts often disrupt active developer workflows. Instead, a pragmatic first step is a phased migration that audits idle uptime and implements simple automated shutdown mechanisms to capture up to forty percent of wasted spend.
Step 1: Audit Your Current Static Footprint
Before modifying infrastructure, we must establish our baseline waste. I evaluated this in previous roles by tagging all non-production resources in AWS, Azure, or Google Cloud Platform with a standardized tag, such as Environment: Staging. We then used Amazon CloudWatch or Datadog to analyze CPU and memory utilization on these tagged instances over a 14-day window. You will likely find that these environments sit entirely idle during nights and weekends—accounting for roughly 112 out of 168 hours in a week (66% idle time). This baseline allows us to safely target a 40% reduction in infrastructure spend without disrupting active developer working hours.
Step 2: Implement the PR-Triggered Auto-Shutdown Script
Rather than building a complex Kubernetes-based control plane on day one, write a basic automation script triggered by your CI/CD pipeline (e.g., GitHub Actions or GitLab CI). This script acts as a pseudo-ephemeral bridge. When a developer opens a pull request, the script starts the target EC2 instances or scales up the AWS ECS service replicas. When the PR is merged or closed, the pipeline automatically scales those specific resources back to zero. This ensures you only pay for compute during active review cycles.
# GitHub Action snippet to stop ECS tasks on PR close
on:
  pull_request:
    types: [closed]
jobs:
  scale-down:
    runs-on: ubuntu-latest
    steps:
      - name: Configure AWS Credentials
        uses: aws-actions/configure-aws-credentials@v2
      - name: Scale Down ECS Service
        run: |
          aws ecs update-service --cluster staging-cluster --service staging-app --desired-count 0
Tradeoffs of the Stopgap Approach
This script-based approach is highly effective for monolithic applications or simple, decoupled microservices because it uses existing infrastructure without requiring service discovery rewrites. However, it breaks down if your system relies on tightly coupled databases with long migration or seed times. If a relational database takes twenty minutes to bootstrap and populate with test data, developers will bypass the automation to avoid waiting, negating your savings.
Your Next Action Step
Run this query against your AWS billing dashboard or Cost Explorer to identify your exact non-production spend over the last 30 days, filtered by your staging tags, and calculate the potential 40% savings to justify the engineering sprint.
Figures cited are from publicly available sources as of 2026-09-15 and may have changed.