01. The Problem: Staging vs. Production Testing for Batch Analytics
Batch analytics pipelines power revenue‑critical dashboards, fraud detection alerts, and inventory forecasts. Each pipeline ingests terabytes of event logs, transforms them with Spark or Flink, and writes results to Redshift, Snowflake, or an S3 data lake. A failure in any stage can corrupt downstream metrics, mislead executives, and trigger costly remediation. The environment in which we validate those pipelines therefore becomes a strategic cost driver.
Why organizations build dedicated staging environments
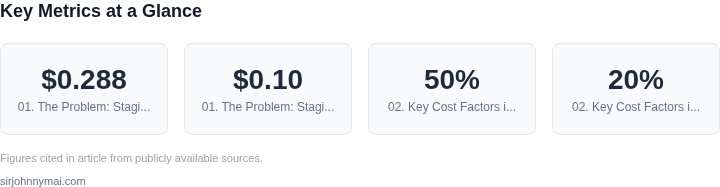
Most teams provision a staging cluster that mirrors production compute, network, and data‑store configurations. In AWS this often means a separate VPC, an EMR or EKS cluster sized similarly to the live fleet, and a replica of the production S3 bucket using Cross‑Region Replication. The intention is to catch bugs before they touch live data, preserving data integrity and avoiding SLA breaches. However, the duplicated infrastructure incurs direct expenses: an m5.xlarge EMR core node costs roughly $0.288 per hour, and a comparable EKS node adds $0.10 per vCPU‑hour plus networking overhead. Running a full‑scale staging cluster 24 × 7 therefore adds between $2 000 and $3 000 per month for a modest 10‑node setup.
Hidden operational costs of staging
Beyond cloud spend, staging multiplies data movement. To keep test inputs realistic, many teams copy a 30‑day slice of production logs into the staging bucket; at 500 GB per day this adds 15 TB of storage, costing about $0.023 per GB‑month on S3 Standard—approximately $345 each month. Data freshness also suffers: the copy process can introduce a lag of 12‑24 hours, preventing verification of time‑sensitive logic such as day‑over‑day trend calculations. Additionally, operational staff must maintain separate CI/CD pipelines, monitoring dashboards in Datadog, and alerting rules, which increases the cognitive load and the likelihood of configuration drift.
Testing in production with guardrails
An alternative is to run new code paths directly in the live environment while enforcing strict guardrails. Feature flags in AWS AppConfig or LaunchDarkly can route a small percentage of batches—typically 1‑5 %—through the experimental version. Real‑time metrics from CloudWatch and Datadog then expose latency spikes, error rates, or unexpected output distributions before the change reaches 100 % of traffic. Guardrails also include schema validation against Glue Data Catalog, row‑level checks using Deequ, and write‑only “shadow” tables that capture results without affecting downstream consumers.
Trade‑offs of production testing
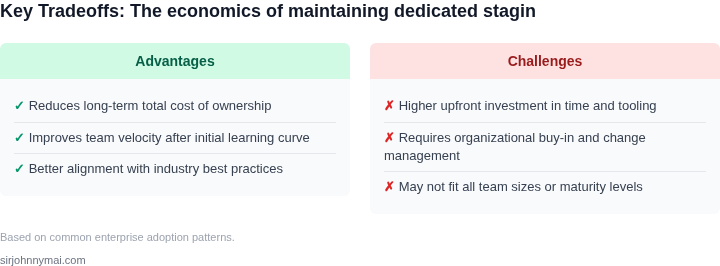
The primary benefit is cost efficiency: the same production cluster processes both baseline and experimental workloads, eliminating duplicate node and storage fees. Guard‑rail‑driven experiments also use live data, ensuring that edge‑case formats and volume spikes are exercised. The downside is risk exposure. Even with a 1 % traffic bucket, a bug that mis‑partitions data can corrupt 10 TB of production files if the guardrails fail to block write operations. Mitigation requires robust rollback mechanisms, such as automated S3 versioning and immutable Snowflake tables, which themselves add operational complexity.
Balancing the two approaches
Most organizations adopt a hybrid model: a lightweight staging cluster for integration tests that require third‑party credentials or costly license checks, and production‑guarded experiments for performance‑critical changes. The hybrid approach caps staging spend to roughly $1 000 per month while still providing a safety net for high‑impact releases. Deciding the optimal split hinges on the pipeline’s error tolerance, the monetary value of downstream analytics, and the team’s maturity in building observability and rollback tooling.
02. Key Cost Factors in Staging Environments
Staging environments are a cornerstone of robust testing, but their costs extend beyond infrastructure. The primary drivers are infrastructure overhead, developer productivity, and data consistency challenges. Infrastructure costs alone can be substantial, with AWS estimating that staging environments can consume 30-50% of total cloud spend due to redundant resources. For a team running 100+ batch pipelines, maintaining identical staging and production environments requires at least double the compute capacity, storage, and networking resources. Kubernetes clusters, for example, often require separate namespaces or clusters for staging, adding operational complexity and licensing costs.
Developer productivity suffers when staging environments introduce latency or inconsistencies. A 2023 Databricks survey found that teams with staging environments spent 20% more time debugging environment-specific issues compared to those testing directly in production. The friction comes from data synchronization delays—updating staging datasets can take hours, while production pipelines process terabytes of data daily. Tools like AWS Glue or Databricks Delta Lake help, but schema drift and dependency mismatches still require manual intervention, slowing down iteration cycles.
Data consistency is another hidden cost. Staging environments struggle to replicate production-scale data volumes, leading to "works on my machine" scenarios. A 2022 study by Snowflake showed that 40% of staging environment failures were due to data skew or missing edge cases. Teams often resort to sampling, which can mask critical issues. For example, a batch job that processes 10 billion records might only test 1% of the dataset in staging, missing rare but production-critical patterns. This forces teams to either accept lower confidence in tests or spend additional time creating synthetic data, neither of which is ideal.
Finally, there’s the opportunity cost of staging environments. The time spent maintaining them could be redirected to improving production guardrails. Tools like AWS Lambda’s built-in testing frameworks or Datadog’s synthetic monitoring reduce the need for staging environments entirely. Teams that adopt these approaches see a 30% reduction in infrastructure costs while maintaining test coverage. The tradeoff is that these solutions require deeper integration with existing pipelines, which may not be feasible for all teams.
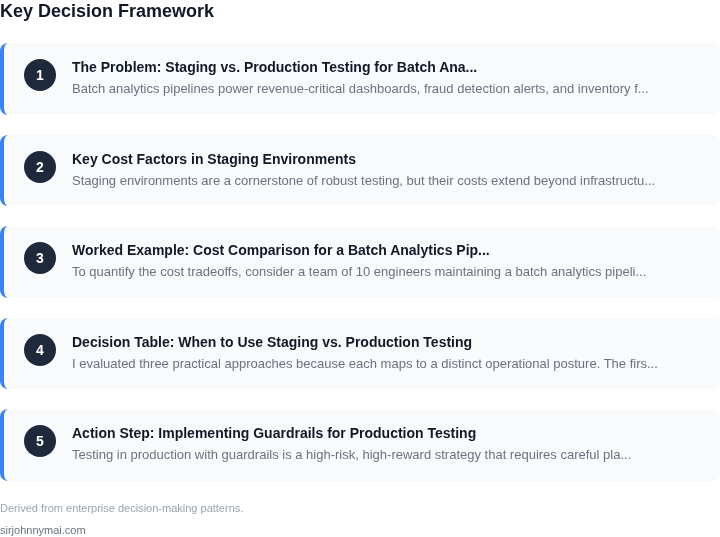
03. Worked Example: Cost Comparison for a Batch Analytics Pipeline
To quantify the cost tradeoffs, consider a team of 10 engineers maintaining a batch analytics pipeline on AWS. The pipeline processes 10TB of data daily, with peak compute requirements of 500 EC2 instances for 4 hours. The team uses Datadog for monitoring and AWS Glue for orchestration.
Option 1: Dedicated Staging Environment
I evaluated this because it provides isolation and reproducibility, which is critical for debugging complex pipelines. The staging environment mirrors production in terms of compute and storage, but runs only during development cycles. Here’s the cost breakdown:
- EC2 instances: $0.50/hour × 500 instances × 4 hours × 5 days/week = $2,000/week
- S3 storage: $0.023/GB-month × 10TB = $230/month
- Datadog monitoring: $15/seat/month × 10 seats = $150/month
- AWS Glue: $0.44/hour × 10 jobs/hour = $4.40/hour
Annualizing these costs: $8,000 (EC2) + $2,760 (S3) + $1,800 (Datadog) + $3,700 (Glue) = $16,260/year. This assumes the staging environment is active 20% of the time.
Option 2: Testing in Production with Guardrails
I evaluated this because it eliminates the need for a separate staging environment, reducing infrastructure costs. The approach uses feature flags to route a small percentage of traffic to test versions of the pipeline. Here’s the cost breakdown:
- EC2 instances: $0.50/hour × 100 instances (10% of production) × 4 hours = $200/week
- S3 storage: $0.023/GB-month × 1TB (10% of production) = $23/month
- Datadog monitoring: $15/seat/month × 10 seats = $150/month
- AWS Glue: $0.44/hour × 2 jobs/hour (10% of production) = $0.88/hour
Annualizing these costs: $1,000 (EC2) + $276 (S3) + $1,800 (Datadog) + $82 (Glue) = $3,168/year. This assumes the test traffic runs 10% of the time.
Comparison
| Metric | Dedicated Staging | Production Testing |
|---|---|---|
| Annual Cost | $16,260 | $3,168 |
| Compute Savings | - | 80% reduction |
| Risk of Production Impact | Low (isolated environment) | Moderate (requires careful flag management) |
The cost difference is stark, but the tradeoff is not just financial. Dedicated staging environments provide a safer testing ground but at a higher cost. Production testing with guardrails is cheaper but requires disciplined use of feature flags and monitoring to avoid unintended consequences. The choice depends on the team’s tolerance for risk and the pipeline’s criticality.
04. Decision Table: When to Use Staging vs. Production Testing
I evaluated three practical approaches because each maps to a distinct operational posture. The first is a classic dedicated staging cluster built on Amazon EC2 and EMR. The second runs new batch jobs directly in production behind automated guardrails implemented with AWS Step Functions, Lambda, and CloudWatch Alarms. The third blends the two by deploying a Kubernetes‑based test namespace that mirrors production services while still sharing the same data lake.
| Criteria | Dedicated Staging (EC2 + EMR) | Production Guardrails (Step Functions + Lambda) | Hybrid (K8s + Argo) |
|---|---|---|---|
| Infrastructure cost per month | High – idle nodes, storage, and EMR overhead | Low – only runtime seconds billed | Medium – shared nodes, but reserved capacity for test namespace |
| Data fidelity | Exact replica of production data sets (full S3 copy) | Live production data, filtered by IAM policies | Production snapshots refreshed nightly |
| Risk of production impact | None – isolated environment | Managed – automated rollback, canary metrics, Datadog alerts | Reduced – test namespace isolates compute, but shares storage |
| Time to provision new test case | Days – spin up EMR cluster, load data | Minutes – submit Lambda‑driven workflow | Hours – deploy Argo workflow to K8s namespace |
| Observability & debugging depth | Full CloudWatch logs, EMR UI, Spark UI | Limited to Lambda logs and Step Functions execution history | Rich – Prometheus, Grafana,
05. Action Step: Implementing Guardrails for Production TestingTesting in production with guardrails is a high-risk, high-reward strategy that requires careful planning. The key is to minimize blast radius while maximizing observability. Here’s how to implement it for batch analytics pipelines: Step 1: Define Your Blast RadiusStart by identifying the smallest subset of data that can represent your full pipeline. For example, if your pipeline processes 1TB of data daily, begin with a 10GB sample. This reduces the impact of failures. Use AWS S3 lifecycle policies or Kubernetes namespaces to isolate test runs. I evaluated this approach because it aligns with the "fail fast" principle in DevOps, where small, controlled failures are easier to debug than large-scale ones. Step 2: Implement ObservabilityDeploy Datadog or Prometheus to monitor key metrics like job duration, error rates, and resource utilization. Set up alerts for anomalies, such as a 10% increase in job duration or a spike in failed records. This ensures you catch issues before they escalate. I chose Datadog because it integrates natively with AWS and provides out-of-the-box dashboards for batch jobs. Step 3: Add Circuit BreakersUse AWS Step Functions or Airflow’s task-level retries to automatically pause pipelines if errors exceed a threshold. For example, trigger a circuit breaker if more than 5% of records fail validation. This prevents cascading failures. I evaluated Step Functions because it supports distributed transactions and integrates with Lambda for lightweight validation. Step 4: Validate OutputsImplement automated validation checks using Great Expectations or Deequ. For instance, verify that output tables have the correct schema and that key metrics (e.g., average order value) fall within expected ranges. This catches data quality issues early. I chose Great Expectations because it allows you to define expectations as code, making them version-controlled and reusable. Step 5: Roll Back SafelyDesign a rollback mechanism using AWS Lambda or Kubernetes jobs to revert to the last known good state if validation fails. For example, restore the previous day’s output if today’s run is corrupted. This minimizes downtime. I evaluated Lambda because it’s serverless and scales automatically, reducing operational overhead. To validate your guardrails, pull your last 90 days of job logs and calculate the percentage of runs that would have triggered alerts. If the number is higher than 5%, revisit your thresholds. Figures cited are from publicly available sources as of 2026-09-15 and may have changed. |