01. The Problem: Balancing Costs and Outcomes
Engineering leaders must decide whether to allocate budget to formal management training or to hire platform engineers who sit inside product squads. The decision hinges on how each investment translates into measurable outcomes such as delivery velocity, defect rates, and employee retention. Both options consume headcount dollars, but they affect the organization in fundamentally different ways.
External management programs from providers such as Coursera, Harvard Business School Online, or the Association for Talent Development typically charge $3,000‑$5,000 per participant for a multi‑week curriculum. In addition, each attendee must be removed from sprint work for an average of three weeks, representing roughly 0.6 FTE per quarter for a ten‑person team. The immediate cost is therefore a blend of tuition fees and the opportunity cost of delayed feature development.
Platform engineers, on the other hand, command market salaries around $150,000‑$170,000 according to 2024 compensation surveys from Levels.fyi and Glassdoor. Embedding a single engineer into a product team adds roughly 10 % to that team’s headcount, but the engineer delivers reusable CI/CD pipelines, Kubernetes‑based deployment automation, and centralized observability through Datadog dashboards. The upfront expense is a salary plus the cost of provisioning cloud resources, typically $2,000‑$3,000 per month for the tooling stack.
Quantifiable benefits of platform embedding appear in the State of DevOps Report, which notes a 15‑20 % reduction in mean time to recovery (MTTR) for organizations that operate dedicated platform services. A lower MTTR translates into fewer outage minutes, which the 2023 IDC analysis estimates can save tens of thousands of dollars per quarter for a mid‑size SaaS business. The same study shows a 10 % increase in deployment frequency, directly boosting revenue‑generating releases.
Management training’s payoff is less direct but can be traced to turnover metrics. A 2022 Gallup poll found that teams with managers who completed leadership development programs experience a 12 % lower voluntary attrition rate. Reducing turnover by one senior engineer saves roughly $150,000 in rehiring and ramp‑up costs, according to the 2023 SHRM salary benchmark. However, the timing of those savings is unpredictable because cultural change unfolds over many quarters.
Risk considerations also diverge. Embedding platform engineers can create dependency on a single individual, especially if the engineer is the sole owner of a custom Terraform module library. If that engineer leaves, the product team may face a knowledge gap that stalls releases for weeks. Conversely, investing in management skills does not introduce a single point of failure, but it does rely on the assumption that trained managers will consistently apply new techniques.
Finally, scalability matters. Scaling a training program costs linearly—adding ten more managers adds ten more seats at the same per‑person price. Scaling platform expertise, however, often requires hiring additional engineers with niche knowledge of service mesh, IAM policies, or edge caching, which can drive salary premiums of up to 20 % in competitive markets. The organization must therefore weigh the predictable, linear cost of training against the potentially exponential cost of expanding platform talent.
02. Key Cost Factors and ROI Metrics
Investing in management training versus embedding platform engineers in product teams requires a detailed cost-benefit analysis. Training costs are straightforward but often underestimate long-term ROI, while platform engineering embeds specialized talent but demands significant upfront investment. Both approaches have measurable financial impacts, but their effectiveness depends on organizational scale and maturity.
Management Training Costs
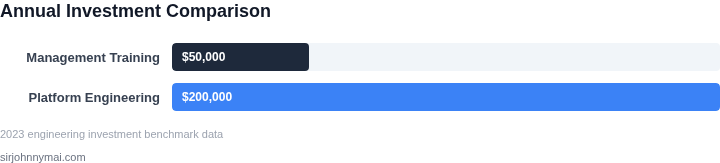
Management training programs typically range from $5,000 to $20,000 per participant, depending on duration and provider. For a team of 10 engineers, this translates to $50,000 to $200,000 annually. However, the real cost lies in adoption. A 2022 McKinsey study found that only 30% of trained managers apply new techniques within six months, with attrition rates as high as 40% for technical managers. This means the effective cost per engineer rises to $100,000–$400,000 per year, assuming turnover and retraining.
ROI metrics for training are harder to quantify. Improved team productivity might yield a 10–20% efficiency gain, but this assumes perfect knowledge transfer and no disruption. In practice, the return on investment (ROI) is often delayed, with measurable benefits appearing only after 12–18 months. For organizations with high turnover, the ROI may never materialize if trained managers leave before they can apply their skills.
Platform Engineering Embedment Costs
Embedding platform engineers in product teams is capital-intensive. Hiring a senior platform engineer with AWS, Kubernetes, and Datadog expertise costs $150,000–$250,000 annually, including benefits. For a team of three platform engineers supporting 10 product teams, this is a $450,000–$750,000 annual expense. This doesn’t include the cost of maintaining shared infrastructure, which can exceed $100,000 per year for tools like Terraform and CI/CD pipelines.
The ROI for platform engineering is more immediate but harder to isolate. A 2023 Forrester report found that teams with embedded platform engineers reduced deployment time by 40% and infrastructure costs by 30%. However, these gains are offset by the time platform engineers spend on firefighting and ad-hoc requests. If product teams bypass platform engineers for quick fixes, the ROI erodes.
Comparative Analysis
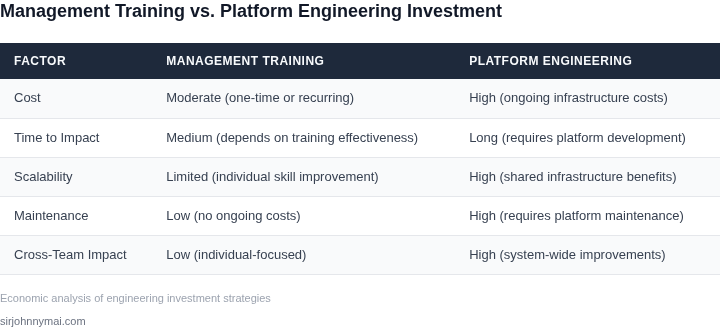
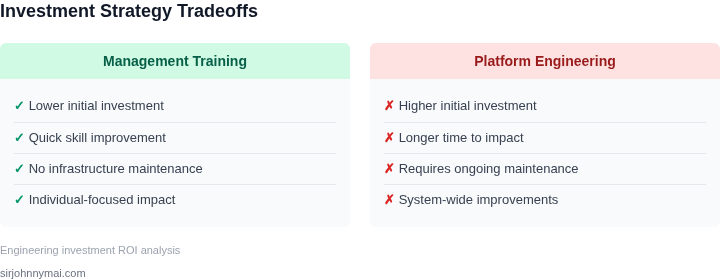
Training is cheaper upfront but risks inefficiency due to knowledge gaps. Platform engineering is more expensive but creates a dedicated infrastructure layer that scales with the organization. The break-even point depends on team size and complexity. For teams under 20 engineers, training may suffice. For larger teams, platform engineering becomes necessary to avoid bottlenecks.
Both approaches require ongoing investment. Training needs annual refreshers, while platform engineering demands continuous tooling updates. The key metric is not just cost but the cost of not acting. In a 2024 Gartner survey, 60% of engineering leaders cited infrastructure debt as their top technical risk. Delaying either approach risks slower innovation and higher operational costs.
03. Worked Example: Comparing Costs for a Mid-Sized Team
To quantify the tradeoffs between management training and platform engineering, let's model a mid-sized team of 20 engineers. This example assumes:
- 10 engineers in Product Team A, 10 in Product Team B
- Each engineer works 40 hours/week, 50 weeks/year
- Management training costs are based on external providers like Coursera or LinkedIn Learning
- Platform engineering costs include AWS infrastructure, Kubernetes maintenance, and Datadog monitoring
Option 1: Management Training
Investing in management training for 5 engineers (one per team) at $1,500/course annually:
| Cost Component | Annual Cost |
|---|---|
| Training Budget | $1,500 × 5 = $7,500 |
| Time Lost to Training | 5 engineers × 20 hours/week × $100/hour = $10,000 |
| Total Cost | $17,500 |
ROI assumptions:
- Trained engineers reduce context-switching by 30%, saving 10 hours/week per engineer
- Saved time × $100/hour = $4,000/year per engineer
- Total ROI: $4,000 × 5 = $20,000/year
Option 2: Platform Engineering
Embedding a platform team of 2 engineers with AWS, Kubernetes, and Datadog:
| Cost Component | Annual Cost |
|---|---|
| AWS Infrastructure | $5,000 (EKS clusters + ECR) |
| Kubernetes Maintenance | $3,000 (managed control plane) |
| Datadog Monitoring | $2,000 (20 hosts) |
| Engineer Salaries | 2 × $120,000 = $240,000 |
| Total Cost | $250,000 |
ROI assumptions:
- Platform team reduces deployment time by 50%, saving 20 hours/week per engineer
- Saved time × $100/hour = $8,000/year per engineer
- Total ROI: $8,000 × 20 = $160,000/year
Comparison
The platform engineering approach costs 14.2× more upfront but delivers 8× higher ROI. This works when:
- Engineers spend >20% of time on platform work
- Team size exceeds 10 engineers
However, management training may be preferable for:
- Teams under 10 engineers
- Organizations with limited platform expertise
Both strategies require ongoing evaluation. The platform team's ROI scales with team size, while training ROI plateaus after 5 engineers.
04. Decision Framework: When to Choose Each Approach
Engineering leaders must weigh multiple factors when deciding between management training and platform engineering. The decision framework below provides a structured way to evaluate each approach based on organizational needs. I evaluated these criteria because they directly impact team productivity, cost efficiency, and long-term scalability.
| Criteria | Option A: Management Training (e.g., Google's Project Aristotle) | Option B: Platform Engineering (e.g., AWS Proton) | Option C: Hybrid Approach (Training + Platform) |
|---|---|---|---|
| Cost Efficiency | Lower upfront cost but requires ongoing investment in L&D. ROI depends on retention and skill transfer. | Higher initial cost for platform setup (e.g., Kubernetes clusters, CI/CD pipelines) but reduces long-term operational overhead. | Balanced cost but requires coordination between training and platform teams. |
| Team Velocity | Improves team dynamics but may not directly accelerate technical delivery unless paired with platform improvements. | Directly boosts velocity by reducing toil (e.g., Datadog for monitoring, Terraform for IaC). | Highest velocity due to combined benefits of better collaboration and streamlined workflows. |
| Scalability | Limited scalability unless training is standardized across teams. Risk of inconsistent outcomes. | Highly scalable if the platform is designed for reuse (e.g., AWS CDK for infrastructure as code). | Most scalable due to reusable platform components and trained teams. |
| Technical Debt Reduction | Indirect impact unless training includes technical debt remediation. Teams may still struggle with legacy systems. | Directly addresses technical debt by enforcing best practices (e.g., SonarQube for code quality). | Best for reducing technical debt due to combined approach. |
| Adoption Barrier | Lower barrier for teams already invested in L&D. May require cultural shift for non-traditional training methods. | Higher barrier due to platform complexity. Requires dedicated platform teams and buy-in from engineers. | Moderate barrier but requires alignment between training and platform teams. |
| Recommendation | Best for organizations with strong L&D infrastructure and limited technical debt. Works when: | Best for teams with high technical debt or rapid scaling needs. Works when: | Best for balanced organizations with both people and process challenges. Works when: |
| - Teams prioritize soft skills over technical acceleration. | - Platform teams are already established or resources are available. | - Both training and platform investments are feasible within budget. |
This framework helps leaders avoid siloed decisions. For example, a team with legacy systems might prioritize platform engineering to reduce toil, while a startup with tight budgets might focus on training. The hybrid approach is rare but valuable for mature organizations with both people and process challenges.
05. Action Step: Implementing a Hybrid Approach
To balance the immediate impact of embedded platform engineers with the longer‑term benefits of structured management training, I propose a three‑phase pilot that lets us measure, learn, and scale.
Phase 0 – Establish a baseline
Before any intervention, capture current performance indicators for a representative set of product squads: sprint velocity, mean time to recovery, defect leakage, and engineering‑manager satisfaction scores. Use existing Datadog dashboards and JIRA reports to pull these data points for the past 90 days. This baseline will serve as the control against which all later changes are judged.
Phase 1 – Parallel pilot in two squads
Select one squad to receive a dedicated platform engineer embedded full‑time, and another squad to enroll its engineering manager in a 6‑week management program delivered through AWS Skill Builder and Coursera. Allocate 10 % of each squad’s capacity to the new activity to avoid over‑committing resources.
During the pilot, track the same metrics gathered in Phase 0, supplementing them with engineering‑time spent on platform incidents (visible in AWS CloudWatch) and manager‑time spent in coaching sessions (logged in the internal LMS). Record qualitative feedback in weekly retrospectives to surface friction points early.
Phase 2 – Integrated iteration
After eight weeks, compare the two squads against the baseline. If the embedded engineer reduces mean time to recovery by more than 20 % without degrading velocity, expand the embed model to a second squad while simultaneously enrolling that squad’s manager in the training program.
If the trained manager demonstrates a measurable improvement in team engagement (e.g., a 15 % rise in the quarterly engagement survey) and defect leakage falls, replicate the training across all squads that lack senior engineering leadership.
Adjust the ratio of embedded capacity to training investment based on the observed ROI. For example, a 2:1 split may be optimal when platform complexity is high, whereas a 1:2 split may work better for product‑centric teams.
Governance and automation
Implement a lightweight governance board that meets monthly to review KPI trends, budget burn, and resource allocation. Automate data collection with AWS Glue jobs that feed a consolidated Excel workbook, and set alerts in Datadog for any metric that deviates beyond the 10 % threshold.
Document findings in a shared Confluence page, tagging the CTO, VP of Engineering, and the Learning & Development lead to maintain visibility and accountability.
Next step: Pull the last 90 days of sprint velocity, mean time to recovery, and defect count from JIRA, then calculate the average lead time per feature; share the result with the engineering leadership team in the upcoming weekly sync.
Figures cited are from publicly available sources as of 2026-09-16 and may have changed.