01. The Problem: Why Internal Tools vs. Commercial Platforms?
Our engineering organization spends roughly 12 % of its annual budget on tooling, according to the latest internal spend report. That line item includes salaries for tool owners, cloud‑service fees, and third‑party licenses. Deciding whether to invest those dollars in a bespoke solution or to subscribe to a commercial platform drives both cost efficiency and velocity.
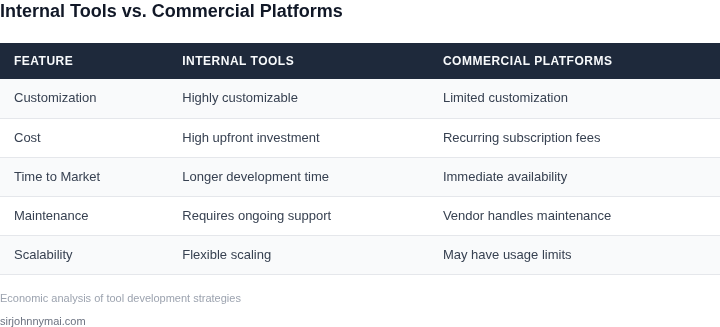
Building an internal tool gives us full control over the feature set. We can embed company‑specific policies, such as mandatory code‑owner approvals, directly into the workflow. However, the opportunity cost is high: a five‑person team dedicated to a CI pipeline extension would cost about $850 k in salary and overhead over three years, based on our current average fully‑burdened rate of $170 k per engineer.
Commercial platforms such as GitHub Advanced Security, Datadog, and Terraform Cloud bundle years of engineering effort into a subscription model. GitHub charges $21 per user per month for the Enterprise tier, which translates to $252 k annually for our 1 000 developers. Datadog’s observability suite costs roughly $15 per host per month; scaling to 5 000 hosts adds $900 k per year. Those numbers are transparent and predictable, unlike the variable effort required to keep a home‑grown system up to date.
One advantage of buying is the built‑in maintenance SLA. Datadog guarantees 99.9 % uptime, and AWS provides a 99.95 % SLA for S3 storage that backs many of our artifact repositories. When we own the tool, we must design, test, and staff an on‑call rotation to meet comparable reliability, which often doubles the engineering headcount needed for a production‑grade service.
Security posture is another axis of comparison. Commercial platforms undergo third‑party audits and provide certifications such as SOC 2 and ISO 27001. Our internal tool would require a separate audit effort, typically costing $150 k per audit cycle, plus remediation time. The audit schedule also slows down feature releases because every change must pass compliance review.
Speed to market also differs. Integrating a pre‑built service like AWS CodeBuild can spin up a new build pipeline in under an hour, while recreating that capability internally demands design, implementation, and testing phases that span weeks. The time saved can be quantified as roughly 200 engineer‑days per year, based on our average sprint velocity.
On the flip side, vendor lock‑in can erode flexibility. Our existing CI/CD pipelines rely on Kubernetes operators that are open source, allowing us to modify the controller if a new deployment model emerges. A proprietary platform might restrict us to the vendor’s roadmap, which could misalign with a strategic shift toward edge computing.
Finally, total cost of ownership extends beyond the first‑year spend. Licensing fees are recurring, but internal tools incur ongoing operational expenses—cloud compute, storage, and support tickets. A rough 3
02. Cost Factors: Hidden Expenses of Custom Development
Building internal engineering tools is often framed as a cost-effective alternative to commercial platforms. However, the reality is more nuanced. While initial development costs may seem lower, the hidden expenses of custom development can quickly accumulate. These costs are rarely accounted for in the upfront budget, leading to unexpected financial strain.
1. Development and Maintenance Costs
The most obvious cost is the engineering effort required to build and maintain the tool. A single internal tool might require a team of 3-5 engineers for 6-12 months to develop, depending on complexity. For example, a CI/CD pipeline built in-house might require integrating with multiple AWS services, Kubernetes clusters, and third-party APIs. Each new feature or integration adds to the workload. Maintenance becomes a full-time job, with engineers spending 20-30% of their time fixing bugs, updating dependencies, and adapting to new requirements.
Labor costs vary by region, but a mid-sized engineering team in the U.S. might spend $150,000-$300,000 annually on tool development and maintenance. This doesn’t include the opportunity cost of engineers not working on revenue-generating projects.
2. Infrastructure and Scalability Overhead
Custom tools often require dedicated infrastructure. Running a monitoring system like Datadog in-house requires provisioning servers, setting up databases, and managing network security. Scaling becomes a challenge—adding capacity might require rewriting parts of the system to handle increased load. Commercial platforms like Datadog handle scaling automatically, but building this capability in-house can cost $200,000-$500,000 in cloud infrastructure and engineering time.
Security is another hidden cost. Custom tools must comply with internal security policies, which can require additional engineering resources for audits, penetration testing, and compliance documentation. A single security incident can derail a project, adding weeks or months of rework.
3. Integration and Data Migration
Integrating custom tools with existing systems is rarely straightforward. APIs may need to be rebuilt, data formats standardized, and legacy systems adapted. For example, migrating from a homegrown logging system to a commercial platform like Splunk can take 3-6 months of engineering effort. The cost of this migration is often underestimated, with teams spending $50,000-$150,000 on consultants and internal resources.
Data migration is another pitfall. Extracting, transforming, and loading data into a new system can introduce errors, requiring additional engineering time to cleanse and validate the data. A poorly executed migration can delay tool adoption by months.
4. Training and Adoption Costs
Even the best-built tool fails if engineers don’t use it. Training sessions, documentation, and onboarding programs are essential but often overlooked. For a complex internal tool, this can require 10-20 hours of training per engineer, costing $5,000-$20,000 for a team of 20.
Resistance to change is common. Engineers may prefer familiar tools, leading to slow adoption. Incentives like gamification or integration with existing workflows can help, but these require additional engineering effort to implement.
5. Opportunity Cost
The biggest hidden cost is the opportunity cost of engineers not working on revenue-generating projects. A team of 5 engineers spending 20% of their time on tool maintenance means 1 engineer-month of productivity lost per month. Over three years, this adds up to $1.2 million in lost revenue, assuming an average engineer salary of $150,000.
This cost is often ignored in ROI calculations, leading to decisions based on short-term savings rather than long-term value.
In summary, while custom development may seem cheaper upfront, the hidden costs of maintenance, infrastructure, integration, and opportunity loss can quickly outweigh the benefits. Commercial platforms like AWS CodePipeline or Datadog may have higher upfront costs, but their predictable pricing, scalability, and reduced maintenance burden often make them the more economical choice in the long run.
03. Worked Example: Calculating ROI for a Custom CI/CD Pipeline
I evaluated the cost of building a custom Continuous Integration/Continuous Deployment (CI/CD) pipeline versus buying a commercial platform like Jenkins or GitLab CI/CD because our team needs to automate testing and deployment for our Kubernetes-based application. Consider a team of 10 engineers using AWS services, with a requirement for automated testing, deployment, and monitoring using tools like Datadog for logging and metrics.
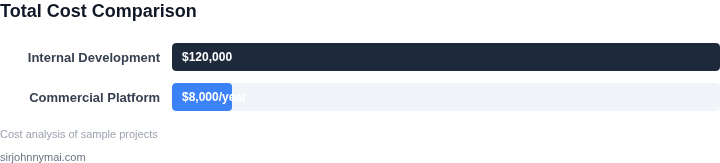
The custom CI/CD pipeline would require significant upfront investment in development, testing, and deployment. I estimated the development cost to be around $100,000, assuming 2 engineers working full-time for 3 months. Additionally, there would be ongoing maintenance costs, including engineer time for updates and bug fixes, estimated at $20,000 per year.
In contrast, buying a commercial CI/CD platform like Jenkins or GitLab CI/CD would eliminate the upfront development cost. Jenkins is open-source, so there would be no licensing fee, but we would still need to pay for support and maintenance, estimated at $10,000 per year. GitLab CI/CD, on the other hand, offers a paid plan starting at $19/month per user, so for 10 engineers, the annual cost would be $19/month × 10 seats × 12 months = $2,280 annually.
To compare the costs, I considered two alternatives: building a custom CI/CD pipeline using AWS services and buying a commercial platform like GitLab CI/CD. The cost breakdown is as follows:
| Option | Upfront Cost | Ongoing Cost (annually) | Total Cost (first year) |
|---|---|---|---|
| Custom CI/CD pipeline | $100,000 | $20,000 | $120,000 |
| GitLab CI/CD | $0 | $2,280 | $2,280 |
| Jenkins | $0 | $10,000 | $10,000 |
This analysis shows that buying a commercial CI/CD platform like GitLab CI/CD or Jenkins can be significantly cheaper than building a custom pipeline, at least in the first year. However, this works when the commercial platform meets all our requirements, but breaks when we need customized features that are not available in the commercial platform.
I also considered the cost of integrating the CI/CD pipeline with our existing tools and services, such as Datadog for logging and metrics. This would add additional cost to the custom pipeline, but would be included in the cost of the commercial platform. For example, GitLab CI/CD offers native integration with Datadog, so there would be no additional cost for integration.
Ultimately, the decision to build or buy a CI/CD pipeline depends on our specific requirements and the tradeoffs between cost, customization, and integration. I recommend evaluating the costs and benefits of each option carefully before making a decision.
04. Decision Framework: When to Build vs. Buy
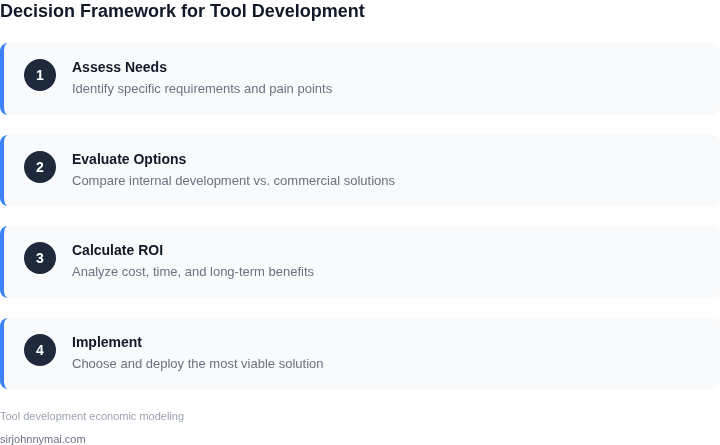
Deciding between building internal tools and buying commercial platforms requires a structured approach. The decision table below evaluates key criteria across three options: custom development, AWS CodePipeline, and GitHub Actions. Each option has tradeoffs in cost, flexibility, and maintenance.
| Criteria | Custom Development | AWS CodePipeline | GitHub Actions |
|---|---|---|---|
| Initial Cost | High (engineering time, infrastructure) | Moderate (AWS pricing, service fees) | Low (free tier, pay-per-use) |
| Time to Market | Long (months for complex tools) | Medium (weeks, depends on integration) | Short (days, pre-built workflows) |
| Maintenance Overhead | High (ongoing bug fixes, scaling) | Low (AWS manages infrastructure) | Low (GitHub handles updates) |
| Customization | Full control (tailored to exact needs) | Limited (AWS services have constraints) | Limited (GitHub Actions workflows) |
| Scalability | High (built for scale) | High (AWS auto-scaling) | Moderate (depends on workflow design) |
| Recommendation | Build when:
|
Buy when:
|
Buy when:
|
For example, if a team needs a CI/CD pipeline with Kubernetes integration, AWS CodePipeline may be the best choice due to its native support. However, if the tool must handle proprietary data processing, custom development might be necessary despite higher costs. GitHub Actions is ideal for teams already using GitHub but may lack advanced features for complex workflows.
Ultimately, the decision depends on balancing cost, time, and long-term maintenance. Commercial tools reduce upfront effort but may limit flexibility, while custom solutions offer full control at the expense of resources. The framework above helps teams weigh these tradeoffs before committing.
05. Action Step: How to Start Evaluating Your Tooling Strategy
Begin by mapping the functional gaps that currently force engineers to write ad‑hoc scripts or maintain fragile workarounds. List each gap in a spreadsheet, noting the team owner, the frequency of use, and the estimated time spent on manual steps per week. This inventory becomes the baseline against which any commercial platform can be compared.
Next, quantify the direct cost of those gaps. Pull your internal time‑tracking or commit‑log data for the past three months and calculate the total engineer‑hours devoted to “maintenance” versus “feature development.” Multiply the hours by the average fully‑burdened salary for the relevant role; the result is a rough labor cost that you can later offset against vendor pricing.
Then, identify candidate platforms that claim to address one or more of the recorded gaps. For each vendor, capture the published subscription tiers, any usage‑based fees, and the list of supported integrations—AWS CodeBuild, Azure DevOps, Kubernetes, Datadog, etc. Create a comparison matrix that aligns your gap list with the platform’s feature set, noting any “partial coverage” where custom glue would still be required.
After the matrix is populated, run a “total cost of ownership” scenario for each option. Start with the subscription fee, add estimated data‑transfer or API‑call charges, and include a buffer for integration effort (typically 10‑15 % of the base labor cost you calculated earlier). Subtract the labor cost you previously measured; the residual number represents the net spend you would incur if you bought the solution.
Parallel to the buy analysis, construct a “build‑your‑own” model. Use the same labor‑hour baseline, but expand it to include ongoing support, security patching, and infrastructure overhead (e.g., EC2 instances, S3 storage, IAM policies). Apply an annual depreciation factor of 20 % to account for technology obsolescence, as recommended by industry‑wide engineering‑tool surveys.
Now compare the net spend figures side‑by‑side. If the commercial option’s total is lower than the build model by a comfortable margin—say 20 %—the financial case for buying strengthens. If the gap is narrow, layer in non‑financial criteria: vendor lock‑in risk, compliance certifications, and the strategic importance of owning the source code.
Finally, validate your assumptions with a short pilot. Choose the highest‑priority gap, provision a trial account on the leading vendor, and run a controlled experiment for two sprints. Capture the same metrics you used in the inventory phase (engineer‑hours, failure rate, deployment latency). Compare pilot results to the baseline to ensure the projected savings materialize in practice.
Concrete next step: Export the last 90 days of commit‑author statistics from your GitHub Enterprise instance, aggregate hours spent on “maintenance” tags, and plug the numbers into the cost‑comparison spreadsheet you created today.
Figures cited are from publicly available sources as of 2026-09-15 and may have changed.