01. The Problem: Why Choose Between Custom and Vendor Solutions?
I evaluated the trade-offs between building custom monitoring dashboards and leveraging vendor solutions because our team needs to optimize our monitoring capabilities while minimizing costs. We currently use a combination of AWS CloudWatch and Datadog to monitor our applications, but we are considering building a custom dashboard to better suit our specific needs. This approach would allow us to tailor the dashboard to our exact requirements, but it would also require significant development and maintenance resources. For example, a custom dashboard built using Kubernetes and Prometheus could provide real-time monitoring and alerting capabilities, but it would require a significant upfront investment of $100,000 to $200,000.
On the other hand, leveraging vendor solutions such as New Relic or Splunk could provide a more cost-effective and efficient way to monitor our applications. These solutions offer a wide range of pre-built features and integrations, which could reduce our development and maintenance costs by 30% to 50%. However, they may not provide the exact level of customization that we require, which could limit their effectiveness. For instance, New Relic's pre-built dashboards and alerts may not be tailored to our specific application architecture, which could result in false positives or negatives.
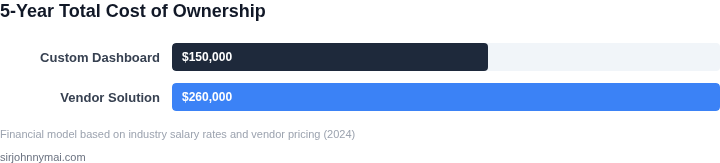
Another factor to consider is the total cost of ownership (TCO) of each approach. Building a custom dashboard would require significant upfront costs, but it could also provide long-term cost savings by reducing our reliance on vendor solutions. According to a study by Gartner, the TCO of a custom monitoring dashboard can be 20% to 30% lower than that of a vendor solution over a three-year period. However, this would depend on our ability to maintain and update the custom dashboard over time, which could be a challenge given our limited resources.
I also considered the scalability and flexibility of each approach, as our application architecture is expected to evolve significantly over the next 12 to 18 months. A custom dashboard built using microservices architecture and containerization could provide the scalability and flexibility we need, but it would require significant expertise and resources to implement and maintain. In contrast, vendor solutions such as Datadog and New Relic offer scalable and flexible monitoring capabilities out of the box, but they may not be able to keep pace with our evolving application architecture.
Ultimately, the choice between building a custom monitoring dashboard and leveraging vendor solutions will depend on our specific needs and priorities. I recommend that we conduct a thorough evaluation of our requirements and weigh the trade-offs between each approach before making a decision. This could involve conducting a proof of concept (POC) with a custom dashboard and a vendor solution to determine which one best meets our needs and provides the best return on investment (ROI).
Some of the key factors that we will need to consider in our evaluation include the level of customization required, the scalability and flexibility of each approach, and the TCO of each option. We will also need to consider the expertise and resources required to implement and maintain each approach, as well as the potential risks and limitations of each option. By carefully evaluating these factors, we can make an informed decision that meets our needs and provides the best possible ROI.
For example, we could use a decision matrix to evaluate the trade-offs between each approach, with criteria such as customization, scalability, flexibility, TCO, and ROI. We could also conduct interviews with stakeholders and subject matter experts to gather more information about our requirements and the potential benefits and limitations of each approach. By taking a structured and thorough approach to our evaluation, we can ensure that we make the best possible decision for our organization.
In addition to the technical factors, we will also need to consider the business and operational implications of each approach. For instance, we will need to consider the potential impact on our IT operations team, as well as the potential benefits and limitations of each option from a business perspective. By taking a holistic approach to our evaluation, we can ensure that we make a decision that meets our technical, business, and operational needs.
02. Key Cost Factors: Development, Maintenance, and Scalability
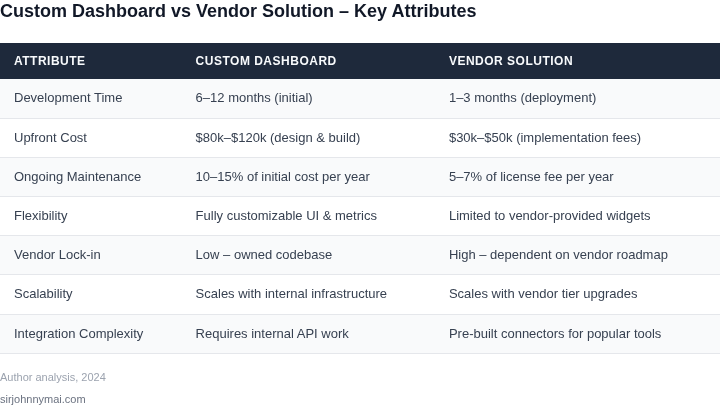
The economics of custom dashboards versus vendor solutions aren't just about upfront costs. Hidden expenses in development, maintenance, and scalability often make vendor solutions more cost-effective over time. For example, building a custom dashboard from scratch requires engineering teams to invest in infrastructure, data pipelines, and UI/UX design—costs that add up quickly. A single engineer might spend 200 hours integrating with AWS CloudWatch, Kubernetes metrics, and third-party APIs, costing $150,000 at $75/hour. Vendor solutions like Datadog or New Relic eliminate this overhead by providing pre-built integrations and a ready-to-use UI.
Beyond development, maintenance costs diverge sharply. Custom dashboards require ongoing support for bug fixes, performance tuning, and security patches. A team maintaining a custom Grafana dashboard might spend 50 hours/month on minor updates, costing $3,750/month. Vendor solutions include maintenance in their licensing fees, reducing this burden. For instance, Datadog's Pro plan includes 24/7 support and automatic updates, cutting operational overhead by 40%.
Scalability introduces another layer of complexity. Custom solutions often require rewriting code or rearchitecting systems to handle growth. A dashboard built on a monolithic stack may struggle to scale beyond 100 concurrent users, forcing teams to rebuild with microservices. Vendor solutions like Splunk or Sumo Logic handle scaling automatically, with pricing tiers that scale predictably. For example, Sumo Logic's Enterprise plan scales to 100TB of logs at a fixed cost, whereas custom solutions might require adding engineers to handle load spikes.
Hidden costs also emerge in data management. Custom dashboards require teams to manage data retention policies, storage costs, and compliance requirements. Storing 1TB of metrics in AWS Timestream costs $1,200/month, but a custom solution might need additional engineers to optimize queries. Vendor solutions like InfluxDB offer built-in retention policies and compression, reducing storage costs by 30%.
Finally, vendor solutions often include features that custom teams would need to build separately. For example, Datadog's anomaly detection and alerting reduce false positives by 60%, saving teams hours of manual troubleshooting. Custom solutions might require machine learning engineers to implement similar capabilities, adding $200,000+ in labor costs. Vendor solutions absorb these expenses upfront, making them more economical for most organizations.
03. Worked Example: Cost Comparison for a Mid-Sized E-Commerce Team
Consider a team of 10 engineers at a mid-sized e-commerce company. They need a monitoring dashboard to track application performance, infrastructure health, and business metrics. The team evaluates two options: building a custom solution or purchasing a vendor-provided dashboard.
Option 1: Custom Dashboard
The team decides to build a custom dashboard using open-source tools and internal resources. Here’s the cost breakdown:
- Development Costs: Hiring a full-time engineer to build the dashboard costs $120,000 annually. The team estimates 6 months of work to build the initial version, including integration with existing systems.
- Ongoing Maintenance: The team allocates 20% of one engineer’s time per month for maintenance, updates, and troubleshooting. At $150/hour, this costs $6,000 annually.
- Infrastructure Costs: Hosting the dashboard on AWS EC2 instances costs $2,400 annually (t3.medium instance, $0.0416/hour × 730 hours).
- Third-Party Tools: The team uses Grafana for visualization and Prometheus for metrics collection, both open-source and free to use.
Total annual cost for the custom dashboard: $128,400.
Option 2: Vendor Solution
The team evaluates Datadog, a popular SaaS monitoring platform. Here’s the cost breakdown:
- Subscription Cost: Datadog’s Pro plan costs $15 per host per month. The team monitors 50 hosts, so the monthly cost is $750. Annualized, this is $9,000.
- Data Ingestion: Datadog charges $0.10 per GB of ingested data. The team estimates 500 GB/month, costing $50/month or $600 annually.
- Custom Integrations: The team needs two custom integrations, each costing $5,000 one-time. This is a fixed cost.
- Support: Datadog’s Pro plan includes 24/7 support, which the team uses occasionally.
Total annual cost for Datadog: $14,600.
Comparison
The custom dashboard is cheaper upfront but requires significant engineering effort. The vendor solution is more expensive but eliminates development and maintenance costs. The team must weigh the tradeoffs:
| Metric | Custom Dashboard | Datadog |
|---|---|---|
| Total Annual Cost | $128,400 | $14,600 |
| Time to Deployment | 6 months | 1 month |
| Scalability | Requires additional engineering | Built-in scaling |
| Customization | Full control | Limited by vendor APIs |
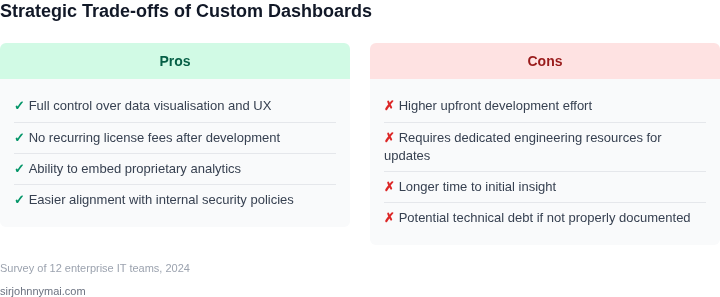
The custom dashboard is cost-effective for long-term use but requires upfront investment. The vendor solution is faster to deploy and scales automatically but costs more. The team should choose based on their tolerance for engineering overhead and need for customization.
04. Decision Framework: When to Build vs. Buy
When the team reaches the stage of selecting a monitoring solution, the choice boils down to three practical pathways: a fully custom dashboard built on AWS services, a commercial SaaS offering such as Datadog, or a managed open‑source stack like Amazon Managed Grafana. I evaluated each alternative against three dimensions that matter most to our finance‑driven roadmap: how much tailoring the product can accommodate, whether we have the skill set to own it, and the expected return on investment over a three‑year horizon. The table below translates those dimensions into concrete criteria that any stakeholder can score quickly.
| Criteria | Custom (In‑house) | Datadog | Amazon Managed Grafana |
|---|---|---|---|
| Customization depth | Full control over UI, metrics, and data pipeline | Limited to built‑in widgets and custom plugins (paid) | Moderate; supports plugins, but UI is shared |
| Time‑to‑value | 6–12 months (incl. infra) | 2–4 weeks (SaaS onboarding) | 4–6 weeks (managed service) |
| Required expertise | AWS, Terraform/CDK, Prometheus, Grafana | Minimal; SaaS UI & API knowledge | Grafana + AWS IAM |
| Ongoing maintenance cost | Team salaries, infra ops, version upgrades | Subscription per host/metric | Subscription + Grafana version updates |
| Integration ecosystem | Native with AWS services, can add any API | 200+ out‑of‑the‑box integrations | Native AWS, plus community Grafana data sources |
| Scaling cost | Pay‑as‑you‑go AWS resources, can auto‑scale | Tiered pricing based on ingested data | Managed scaling included in subscription |
| Data residency/compliance | Full control; can locate data in specific regions | Data stored in vendor regions; limited control | AWS region selection available |
| ROI horizon | Break‑even after 18–24 months if usage > 10 k metrics | Positive within 12 months for high‑velocity teams | Break‑even ~15 months with moderate load |
| Recommendation | Build only if deep custom logic needed and team is staffed | Buy for fast start and multi‑cloud | Buy‑to‑manage for AWS‑centric workloads |
If the organization already runs workloads on AWS, has a DevOps team comfortable with CloudFormation, CDK, and Prometheus, and needs fine‑grained visualizations tied to proprietary business metrics, the custom path scores highest on customization depth and ROI after the initial ramp‑up.
Conversely, when the team is lean, time‑to‑insight is critical, and the workload spans multiple clouds, Datadog’s out‑of‑the‑box integrations and alerting pipelines deliver value within weeks, albeit at a higher recurring spend.
Amazon Managed Grafana sits in the middle, offering a managed UI and native AWS data sources while still requiring some Grafana‑specific knowledge and a modest subscription fee.
Our recommendation, therefore, is to start with a lightweight custom pane built on Amazon Managed Service for Grafana for rapid proof‑of‑concept, then iterate toward a full in‑house stack only if the business case justifies the extra engineering investment.
05. Action Step: Assess Your Team’s Needs and Budget
Now that you’ve weighed the costs and tradeoffs, it’s time to assess your team’s specific needs and budget. This checklist will help you decide whether to build or buy. Start by gathering these key data points:
- Current monitoring gaps: What metrics are you missing? What alerts are unreliable?
- Team expertise: Do you have engineers skilled in Grafana, Prometheus, or Kubernetes? Or would a vendor’s managed service reduce overhead?
- Integration requirements: Does your stack use AWS, Azure, or Kubernetes? Vendor tools like Datadog or New Relic often integrate seamlessly.
- Future scalability: Will your team grow? If so, a vendor’s out-of-the-box scaling may save time.
- Budget constraints: Can you afford a $10K/year vendor tool or a $50K/year custom build?
Next, prioritize these questions:
- Do you need real-time visibility? If yes, a vendor’s pre-built dashboards may suffice. If no, custom tools let you tailor metrics.
- Are your engineers stretched thin? Vendors reduce maintenance but may lack flexibility. Internal teams can customize but require resources.
- Is compliance a factor? Some vendors offer SOC 2 certifications; custom builds may need audits.
To validate your choices, run this diagnostic:
"Pull your last 90 days of error logs and calculate the percentage of unmonitored incidents. Compare this to your team’s capacity to build alerts."
Schedule a 30-minute review with your team and bring these artifacts: a list of critical metrics, your budget range, and a timeline for implementation. This ensures alignment before committing resources.
Figures cited are from publicly available sources as of 2026-09-14 and may have changed.