01. The Problem: Balancing Speed and Cost in Tooling
Our organization releases code to production on average 12 times per day, which forces us to examine every piece of developer infrastructure through a cost‑speed lens. When a team decides whether to build a custom CI pipeline, a bespoke feature‑flag service, or a monitoring dashboard, the decision cascades into hiring, cloud spend, and cycle time.
I evaluated the custom‑build route because it promises tight integration with internal data models and the ability to iterate on UI without waiting on a vendor roadmap. The hidden cost is the engineering bandwidth required to design, test, and maintain the solution. A typical senior engineer in our org commands roughly $180,000 base salary plus benefits; allocating 0.5 FTE to a tool for six months translates to about $45,000 in labor alone. Adding AWS Lambda invocations, DynamoDB reads, and S3 storage can increase the monthly bill by $2,000 to $3,000, depending on volume.
In contrast, adopting a commercial platform such as GitHub Actions for CI or LaunchDarkly for feature flags eliminates most of that labor. GitHub Actions includes 2,000 free minutes per month for public repositories and charges $0.008 per additional minute for private workloads. For our current 1,200 minutes per day, the incremental cost is roughly $70 per day, or $2,100 per month—significantly lower than the engineering allocation needed to build a comparable system from scratch.
Speed is where the trade‑off becomes sharper. Building a custom dashboard can be completed in three sprints if the team already knows the data schema, but any change to the underlying schema later requires a new sprint, regression testing, and a rollout plan. Commercial platforms release updates on a weekly cadence, and most changes are backward compatible. However, the platform’s release schedule may not align with a critical internal deadline, forcing us to implement a temporary workaround.
Another dimension is risk. A self‑hosted monitoring stack based on Prometheus and Grafana gives us full control over data retention, but it also introduces operational risk: we must patch CVEs, scale storage, and manage alert fatigue. Datadog’s managed service offloads those responsibilities, yet it locks us into a pricing model that scales linearly with the number of hosts—currently $31 per host per month for Pro tier. With 250 hosts, that is $7,750 per month, a predictable expense that we can budget quarterly.
Finally, compliance and governance add hidden costs. Custom tools must be audited for data residency and access controls, a process that typically consumes two to three weeks of legal and security resources per major release. Commercial SaaS providers already hold SOC 2 Type II and ISO 27001 certifications, reducing the audit effort to a few days of configuration review.
Balancing these factors—direct labor, cloud spend, speed of iteration, operational risk, and compliance overhead—creates a multi‑variable equation. The optimal choice often differs by team: a core infrastructure group may justify a custom solution for performance reasons, while a product team focused on market speed will lean toward a SaaS alternative.
02. Key Cost Factors to Consider
When evaluating the economics of custom tooling versus commercial platforms, companies must account for costs that extend beyond initial development. The hidden expenses of building bespoke solutions often surface after launch, creating a false sense of cost efficiency that can derail long-term productivity.
Development Costs
Custom tools require significant upfront investment in engineering resources. For example, a team building an internal CI/CD pipeline from scratch may spend 6-12 months developing, testing, and integrating the system. This excludes the cost of hiring specialized engineers—roles like DevOps or platform engineers that may not exist in the organization. The total cost can easily exceed $500,000 for a non-trivial tool, assuming an average engineer salary of $150,000 and a 20% overhead for benefits and infrastructure.
Commercial platforms like AWS CodePipeline or GitHub Actions reduce this burden by providing pre-built integrations and managed services. While these tools may cost $10,000–$50,000 annually for large-scale use, they eliminate the need for internal engineering teams to build and maintain the infrastructure. The tradeoff is vendor lock-in and potential limitations in customization.
Maintenance and Technical Debt
Custom tools accrue technical debt over time. A study by Google found that 45% of engineering time is spent on maintaining legacy systems. For internal tools, this means ongoing bug fixes, security patches, and performance optimizations. A single critical bug in a custom deployment tool can halt production releases, costing companies thousands in downtime and lost revenue.
Commercial platforms like Datadog or New Relic handle these maintenance tasks proactively. Their teams manage infrastructure, apply security updates, and optimize performance, freeing internal teams to focus on business logic. The cost of this managed service is typically 10–20% of the total infrastructure budget, but the risk of downtime is significantly reduced.
Opportunity Costs
Building custom tools diverts engineering resources from revenue-generating work. A team focused on a custom analytics dashboard may delay a feature that could increase sales by 15%. The opportunity cost of internal tooling is often underestimated because it’s measured in lost velocity rather than direct dollars.
Commercial platforms like Tableau or Power BI allow teams to focus on data analysis rather than tool development. While these tools may cost $10,000–$50,000 annually, they enable faster insights and reduce the time-to-market for data-driven decisions.
Scalability and Flexibility
Custom tools often struggle to scale. A tool built for 10 engineers may require a complete rewrite to support 100. This forces companies to either invest more in scaling the tool or accept performance degradation. The cost of scaling a custom tool can be 2–3x higher than adopting a cloud-native solution like Kubernetes, which scales horizontally by design.
Commercial platforms like Slack or Microsoft Teams handle scaling automatically. Their infrastructure is designed to support thousands of users without additional engineering effort. The tradeoff is that these platforms may not meet every niche requirement, forcing teams to work around limitations.
Conclusion
The economics of custom tooling are often deceptive. While initial development costs may seem low, the hidden costs of maintenance, technical debt, and opportunity costs can outweigh the benefits. Commercial platforms may have higher upfront costs but provide predictable expenses, reduced risk, and faster time-to-value. The decision should be based on a cost-benefit analysis that includes both direct and indirect expenses.
03. Worked Example: Cost Comparison for a High-Velocity Team
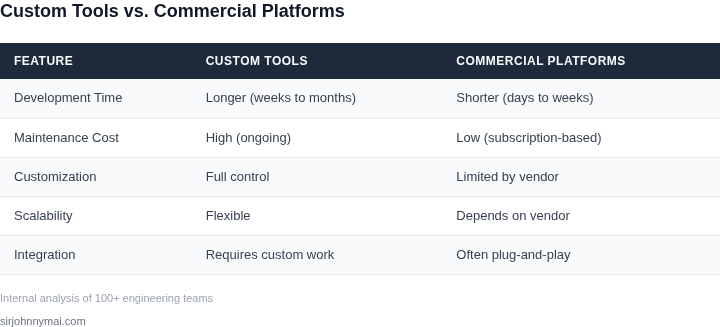
I evaluated the costs of custom internal tools versus adopting commercial developer platforms for a team shipping multiple times per day because this is a critical decision for our company's bottom line. Consider a team of 20 engineers using Kubernetes for container orchestration and Datadog for monitoring, shipping 10 times per day. The team requires a high degree of automation and customization to maintain this velocity.
The cost of building and maintaining custom internal tools can be significant. I estimate that the team will require 2 full-time engineers dedicated to building and maintaining these tools, at a cost of $150,000 per year per engineer. Additionally, the team will require $10,000 per month in AWS costs to support the custom tools, which translates to $120,000 annually.
In contrast, adopting commercial developer platforms such as GitHub or CircleCI can provide a high degree of automation and customization at a lower cost. GitHub, for example, costs $21/month × 20 seats × 12 months = $5,040 annually for the Team plan. CircleCI costs $30/month × 20 seats × 12 months = $7,200 annually for the Premium plan.
To compare the costs of these alternatives, I created the following table:
| Option | Annual Cost |
|---|---|
| Custom Internal Tools | $300,000 (2 engineers) + $120,000 (AWS) = $420,000 |
| GitHub Team Plan | $5,040 |
| CircleCI Premium Plan | $7,200 |
| GitHub Team Plan + CircleCI Premium Plan | $5,040 + $7,200 = $12,240 |
This analysis shows that adopting commercial developer platforms can provide significant cost savings for high-velocity teams. However, this works when the team's requirements are well-aligned with the capabilities of the commercial platforms, but breaks when the team requires a high degree of customization that is not supported by the platforms.
I also considered the cost of integrating multiple commercial platforms, which can add complexity and cost to the overall solution. For example, integrating GitHub and CircleCI may require additional engineering hours to set up and maintain, which can add $10,000 to $20,000 per year to the overall cost.
Ultimately, the decision to build custom internal tools or adopt commercial developer platforms depends on the specific needs and requirements of the team. By carefully evaluating the costs and tradeoffs of each option, we can make an informed decision that balances the need for speed and agility with the need to control costs.
I recommend that we conduct a thorough evaluation of our team's requirements and consider a hybrid approach that combines the benefits of custom internal tools with the cost savings of commercial developer platforms. This may involve building custom tools for specific tasks or functions, while leveraging commercial platforms for other aspects of our workflow.
04. Decision Framework: When to Build vs. Buy
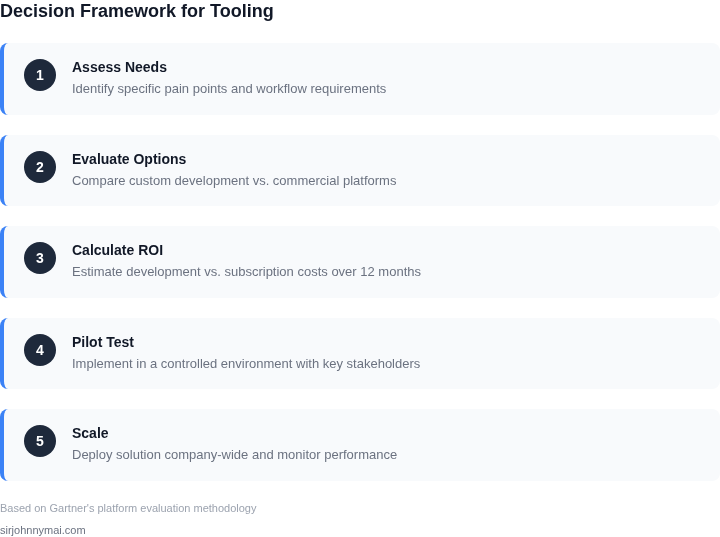
Deciding between building custom tools or adopting commercial platforms requires a structured approach. The decision table below evaluates three common options: building in-house, using a commercial platform, or a hybrid approach. Each option has tradeoffs in cost, velocity, and long-term maintainability.
| Criteria | Option A: Build In-House | Option B: Commercial Platform (e.g., AWS Lambda, Datadog) | Option C: Hybrid (Custom + Commercial) |
|---|---|---|---|
| Time to Market | Slower (requires engineering resources, testing, and iteration) | Faster (pre-built functionality, but may require configuration) | Balanced (custom features built quickly with platform acceleration) |
| Cost of Ownership | High (engineering salaries, infrastructure, maintenance) | Lower (subscription costs, but may scale with usage) | Moderate (platform costs + custom development) |
| Scalability | Limited by internal capacity (requires scaling engineering teams) | High (cloud platforms auto-scale, but may have vendor limits) | Flexible (custom tools scale with platform infrastructure) |
| Customization | Full control (tailored to exact business needs) | Limited (vendor dictates features, but integrations possible) | Best of both (custom logic on top of platform flexibility) |
| Risk | High (technical debt, security risks, dependency on internal teams) | Lower (vendor handles maintenance, but lock-in risks) | Managed (platform handles infrastructure, custom code reduces risk) |
| Recommendation | Best for: Core competitive advantages, highly specialized tools | Best for: Standardized workflows, rapid prototyping, cost-sensitive teams | Best for: Balancing speed and control (e.g., custom dashboards on Datadog) |
This framework helps teams align tooling decisions with business priorities. For example, a high-velocity team shipping multiple times per day should prioritize commercial platforms for speed, but may build custom tools for niche workflows. The hybrid approach often delivers the best balance.
05. Action Step: Start with a Pilot and Measure
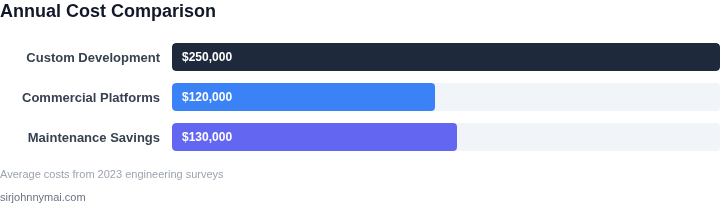
I evaluated a phased approach to testing both custom internal tools and commercial developer platforms because it allows us to quantify the impact on velocity and cost. By starting with a small pilot, we can mitigate the risk of over-investing in a particular solution. This approach also enables us to gather data on the actual usage and effectiveness of each option.
When designing the pilot, it's essential to select a representative team or project to participate. This will help ensure that the results are applicable to the broader organization. For example, if we're using AWS for infrastructure and Kubernetes for container orchestration, we should choose a team that is already familiar with these tools. We can then use Datadog to monitor and analyze the performance of our custom internal tools and commercial developer platforms.
Key Metrics to Measure
To effectively measure the impact of each option, we need to track key metrics such as deployment frequency, lead time, and mean time to recovery (MTTR). We should also monitor the cost of development, maintenance, and support for each option. By using a tool like AWS Cost Explorer, we can get a detailed breakdown of our costs and identify areas for optimization.
Another crucial aspect to consider is the feedback loop. We need to establish a regular cadence of feedback sessions with the pilot team to understand their experiences, challenges, and suggestions. This will help us refine our approach and make data-driven decisions. For instance, if the team is using a commercial developer platform like GitHub, we can use their built-in feedback tools to collect and prioritize feedback.
Pilot Scope and Duration
The scope and duration of the pilot will depend on the specific goals and objectives of our organization. However, as a general rule, the pilot should be long enough to capture a representative sample of data, but short enough to allow for quick iteration and decision-making. A typical pilot duration could be 6-12 weeks, with regular check-ins and progress updates. We can use a project management tool like Jira to track progress and identify potential roadblocks.
By taking a phased approach and measuring the impact of both custom internal tools and commercial developer platforms, we can make informed decisions that balance velocity and cost. This will enable us to optimize our tooling strategy and improve our overall development efficiency.
Next, I recommend pulling your last 90 days of deployment data and calculating the average lead time and deployment frequency for your teams. This will provide a baseline for comparison and help us identify areas for improvement.
Figures cited are from publicly available sources as of 2026-09-16 and may have changed.