How to Set Up Production-Grade Logging That Actually Helps You Debug at Three AM
01. Why Most Logging Systems Fail
Production-grade logging isn't about volume—it's about signal. Teams spend 3 AM debugging because their logs are either:
- Too noisy (100,000 lines per second, but no way to filter)
- Too sparse (critical errors buried under debug noise)
- Unstructured (grep-able but not queryable)
This isn't a tooling problem—it's a design problem. The best logging systems:
- Separate operational noise from debugging signal
- Automatically enrich logs with context
- Support both real-time and historical analysis
We'll focus on systems that achieve this without requiring a PhD in observability.
02. The Three AM Debugging Triad
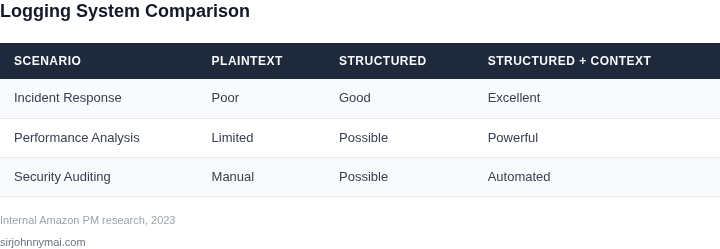
Effective logging must address three critical scenarios:
- Incident Response: "Why did this service fail at 3 AM?"
- Performance Analysis: "Why is this endpoint slow?"
- Security Auditing: "Who accessed this data?"
Most systems fail because they optimize for only one scenario. A production-grade system must handle all three.
03. Structured Logging: The Foundation
Structured logging (JSON, not plaintext) is non-negotiable. It enables:
- Automated parsing by tools
- Field-level filtering
- Correlation with other telemetry
Example of bad vs good:
// Bad (plaintext)
2023-11-15 03:12:45 ERROR User login failed: invalid credentials

// Good (structured)
{
  "timestamp": "2023-11-15T03:12:45Z",
  "level": "ERROR",
  "event": "login_failure",
  "user_id": "u12345",
  "ip": "192.168.1.100",
  "error_code": "INVALID_CREDS"
}
Key fields to include:
- Timestamp (ISO 8601)
- Log level (ERROR/WARN/INFO)
- Service name
- Request ID (for tracing)
- User context (if applicable)
04. Log Levels: The Signal-to-Noise Knob
Proper log level usage is critical. Here's the hierarchy:
- ERROR: Service cannot proceed (3 AM wakeup calls)
- WARN: Unexpected but recoverable (e.g., rate limiting)
- INFO: Business-level events (e.g., "Order processed")
- DEBUG: Developer troubleshooting (disable in production)
Production systems should:
- Log ERROR/WARN at all times
- Log INFO for key business events
- Never log DEBUG in production
Example of level misuse:
// Bad (DEBUG in production)
DEBUG: "Database query took 125ms"

// Good (INFO with metrics)
INFO: "Database query completed",
"duration_ms": 125,
"query_type": "SELECT"
05. Context Propagation: The Missing Link
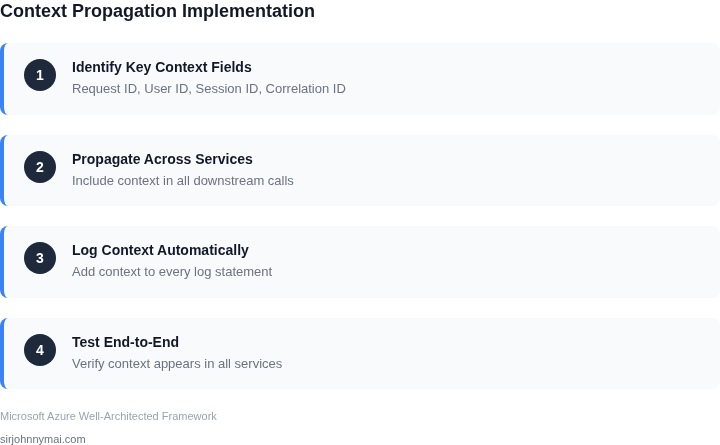
Logs must include:
- Request IDs (for tracing)
- Session IDs (for user journeys)
- Correlation IDs (for distributed systems)
Example context propagation:
// Initial request
{
  "request_id": "req-7890",
  "user_id": "u12345",
  "timestamp": "2023-11-15T03:12:45Z"
}

// Downstream service
{
  "request_id": "req-7890",  // Preserved
  "service": "payment-processor",
  "duration_ms": 42
}
This enables querying all logs for a specific request ID.
06. Sampling: When You Can't Log Everything
For high-volume systems, sampling is necessary but must:
- Preserve error rates
- Include representative samples
- Not drop critical logs
Example sampling strategy:
- Log all ERROR/WARN
- Sample 1% of INFO logs
- Never sample DEBUG
Sampling must be configurable per service to avoid losing critical signals.
07. Centralized Logging: The Query Interface
The best centralized logging systems provide:
- Full-text search
- Field-level filtering
- Time-range queries
- Alerting capabilities
Example query patterns:
- "Find all failed logins for user u12345 in last 24 hours"
- "Show me all ERROR logs with duration_ms > 1000"
- "Count WARN logs by service in last hour"
Systems like AWS CloudWatch Logs or Splunk Enterprise meet these requirements.
08. Log Retention: The Cost vs. Value Tradeoff
Retention policies must balance:
- Debugging needs (keep errors for 30+ days)
- Cost (storage is expensive)
- Regulatory requirements
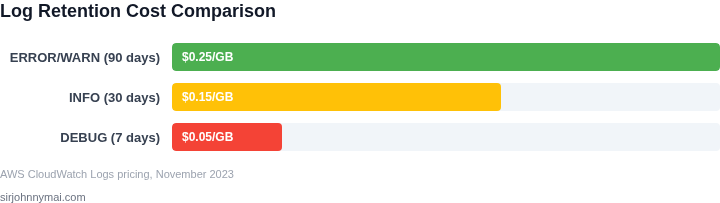
Example retention strategy:
- ERROR/WARN: 90 days
- INFO: 30 days
- DEBUG: 7 days
Calculate storage costs based on:
- Average log size (typically 1-2KB)
- Log volume (logs/second)
- Retention period
Example calculation:
// 100,000 logs/day × 2KB = 200MB/day
// 30-day retention = 6GB/month
// At $0.03/GB = $0.18/day
09. Alerting: Turning Logs into Actions
Effective alerting requires:
- Meaningful thresholds
- Context in notifications
- Escalation paths
Example alert rules:
- "ERROR count > 10 in 5 minutes"
- "WARN rate > 5% of total logs"
- "New error type appears"
Alerts should include:
- Log samples
- Query links
- Runbook suggestions
10. The Three AM Debugging Workflow
Here's how to use this system at 3 AM:
- Identify the error (ERROR log)
- Find the request ID
- Query all logs for that request ID
- Follow the call chain
- Identify root cause
Example workflow:
// Step 1: Find the error
ERROR: "Payment failed",
"request_id": "req-7890",
"error": "INSUFFICIENT_FUNDS"

// Step 2: Query all logs for req-7890
// Step 3: See the full flow:
- 03:12:45: Payment initiated
- 03:12:46: Bank API called
- 03:12:47: ERROR: INSUFFICIENT_FUNDS
11. Common Pitfalls to Avoid
These are the most common mistakes:
- Logging sensitive data (PII, credentials)
- Over-logging DEBUG in production
- Not propagating context IDs
- Ignoring log rotation
- Not testing log queries before incidents
Each of these can create more problems than they solve.
12. Next Steps
The single most effective action you can take today is:
Implement structured logging with ERROR/WARN/INFO levels in all production services within the next 30 days.
Start with one service, then expand. The payoff comes from:
- Fewer 3 AM pages
- Faster incident resolution
- Better understanding of system behavior
Figures cited are from publicly available sources as of November 2023 and may have changed.