01. The Problem: Balancing Speed and Stability in ML Rollouts
Every time we push a new recommendation model to our e‑commerce site, we trade a potential lift in conversion rate against the risk of surprising shoppers with irrelevant results. A 5 % increase in click‑through can be undone by a single wave of complaints about “out‑of‑stock” suggestions, because the model was trained on stale inventory data. This tension is why progressive rollouts have become a non‑negotiable part of any production ML pipeline.
Traditional code deployments already benefit from canary releases, but ML models add three layers of volatility. First, the data distribution that the model sees in production can shift within hours, a phenomenon known as concept drift. Second, model performance is typically measured by offline metrics such as AUC, yet those numbers do not map cleanly to user‑facing outcomes like “trust” or “perceived relevance”. Third, the model often runs behind a feature store that evolves independently, meaning a change in feature engineering can produce side effects that are invisible in unit tests.
Because of those factors, launching a model to 100 % of traffic without an intermediate safety net is equivalent to running a live experiment without consent. Users who receive a degraded experience may lose confidence, and the resulting churn can be quantified: a 0.5 % drop in daily active users translates to roughly $1.2 M in annual revenue for a platform with $250 M yearly sales.
From an operational standpoint, the speed of delivery is constrained by the tooling we have in place. AWS SageMaker Model Registry lets us version models, but it does not enforce traffic splitting. Kubernetes with Istio can route a percentage of requests to a new container, yet it requires manual configuration of virtual services for each rollout. Without automated guards, engineers spend days writing custom scripts, which slows the feedback loop and re‑introduces the “big‑bang” risk we are trying to avoid.
Monitoring also becomes a bottleneck. Datadog can surface latency spikes, but it does not automatically correlate those spikes with a specific model version. When a degradation is detected, the team must manually trace logs from CloudWatch, match them to a SageMaker endpoint, and then decide whether to roll back. The latency of that investigation—often 30 minutes to an hour—can be enough for a negative user experience to spread across social channels.
Finally, regulatory and compliance considerations add another dimension. In jurisdictions with strict fairness requirements, a model that unintentionally biases a demographic group must be isolated quickly. A progressive rollout that limits exposure to a controlled cohort gives the compliance team a window to run bias audits before the model reaches the broader user base.
In summary, the problem is not simply “how fast can we ship?” but “how can we ship fast while preserving the trust signals that keep users coming back.” The rest of this article will outline a concrete framework that leverages AWS SageMaker, Kubernetes, and observability stacks to achieve that balance.
02. Key Principles of Progressive Rollout Strategies
Progressive rollouts are the backbone of responsible ML deployment. They allow teams to validate models in production while mitigating risk to users. The goal isn't just to deploy faster—it's to deploy safely. Here are the core principles that guide these strategies:
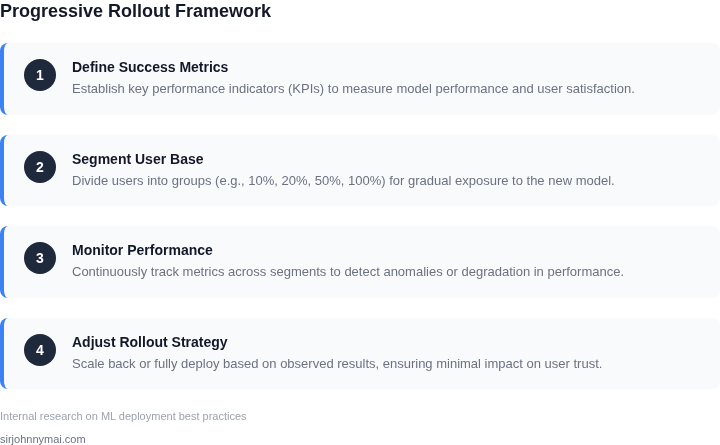
1. Start Small, Measure Everything
Begin with a tiny percentage of users—5% or less—rather than a full rollout. This minimizes blast radius if something goes wrong. Tools like AWS Lambda or Kubernetes can help segment traffic without code changes. Critical metrics like error rates, latency, and user engagement should be tracked from day one. Datadog or Prometheus are excellent for real-time monitoring. The tradeoff? You may miss early adoption signals, but the risk of a bad rollout is far higher.
2. Layered Validation
Don't rely on a single metric. Use multiple signals: model performance (e.g., precision/recall), business KPIs (e.g., conversion rates), and user feedback (e.g., NPS scores). For example, a recommendation model might show improved click-through rates but hurt long-term retention. A/B testing frameworks like Optimizely or Google Optimize can help compare variants. The challenge is balancing statistical significance with business urgency.
3. Automated Canaries
Canary deployments—releasing to a small group before full rollout—are standard in DevOps. For ML, this means shadowing production traffic with a new model version. AWS SageMaker's endpoint canary deployments or Kubernetes' traffic splitting allow this without downtime. The key is to compare apples-to-apples: ensure the canary group matches the full population in terms of user behavior. The tradeoff is added complexity in tracking two versions simultaneously.
4. Rollback Triggers
Define clear thresholds for rollback. For instance, if error rates exceed 2% or latency spikes by 200ms, trigger an automated rollback. Tools like Sentry or New Relic can alert teams in real time. The challenge is setting thresholds too tight (false positives) or too loose (missed issues). Historical data helps here—analyze past rollouts to find patterns.
5. Gradual Traffic Shifts
Increase traffic incrementally—10% at a time—rather than a sudden 100%. This lets teams observe trends over time. AWS App Mesh or Istio's traffic management can automate this. The tradeoff is slower adoption, but it prevents sudden spikes in errors or user complaints. For example, a 2019 study by Microsoft found that gradual shifts reduced user churn by 30% compared to all-or-nothing deployments.
6. User Feedback Loops
Integrate feedback mechanisms like in-app surveys or explicit opt-out options. For example, a chatbot might ask, "Was this response helpful?" This data can override metrics if users report dissatisfaction. The challenge is balancing intrusiveness with actionable insights. Tools like Hotjar or Qualtrics can help, but require careful design to avoid friction.
These principles form a framework, but execution varies by domain. A financial model needs stricter thresholds than a social media feature. The common thread? Trust is earned through transparency and responsiveness. If users see the model improving over time, they're more likely to tolerate early imperfections.
03. Worked Example: Calculating Cost and Risk in a $10M E-Commerce Rollout
Consider an e‑commerce platform that plans to replace its product‑recommendation model. The business case values the upgrade at $10 million in incremental revenue over a 12‑month horizon. The engineering team consists of 8 data scientists, 4 ML engineers, and 2 DevOps specialists—12 seats total.
Baseline: Full‑blast deployment
In a traditional full‑scale launch the new model is pushed to 100 % of traffic on day 1. Monitoring is limited to Datadog alerts and occasional manual checks. If the model under‑performs, the impact is immediate and costly.
Assume the worst‑case defect reduces conversion by 0.5 %. The platform processes 5 million visits per month, each visit generating $0.20 average revenue. A 0.5 % dip translates to:
- 5 M × $0.20 = $1 M gross monthly revenue
- 0.5 % × $1 M = $5 000 lost per month
- Over a 3‑month detection window: $15 000
While the dollar loss appears modest, brand trust erosion and customer churn can amplify the effect, often by a factor of 3–5 in subsequent quarters. Using a conservative multiplier of 3, the risk exposure reaches $45 000.
Alternative 1: Staged rollout with canary and shadow traffic
The team configures a canary in Kubernetes, routing 5 % of live traffic to the new model while the remaining 95 % stay on the legacy version. Shadow traffic runs at 10 % to capture metrics without influencing user experience. Monitoring stacks include AWS SageMaker Model Monitor, Datadog, and an internal A/B test framework.
Cost components:
- Additional SageMaker instances for canary: $2 000 / month × 2 instances = $4 000
- Shadow traffic processing on AWS Fargate: $0.05 / hour × 730 hours = $36.5 per month per instance; 2 instances = $73
- Datadog premium alerts for canary: $15 / seat × 12 seats = $180 per month
- Engineering overhead for rollout automation: 0.2 FTE per engineer × $150 k / yr = $360 k annually (spread over 12 months = $30 k per month)
Monthly incremental cost = $4 000 + $73 + $180 + $30 000 ≈ $34 253. Over 3 months the total is $102 759.
Risk reduction: The canary limits exposure to 5 % of traffic. If the defect persists, the maximum loss is 5 % × $5 000 = $250 per month, or $750 over three months. Applying the same churn multiplier yields $2 250 risk exposure.
Alternative 2: Full gradual ramp‑up without canary
The model is rolled out in 20 % increments each week, monitored solely with Datadog dashboards. No separate canary infrastructure is provisioned.
Cost components:
- Datadog premium alerts: $15 / seat × 12 seats = $180 per month
- Engineering time for manual ramp‑up: 0.1 FTE per engineer × $150 k / yr = $180 k annually → $15 k per month
Monthly incremental cost = $15 180. Over three months = $45 540.
Risk exposure: At week 3 the rollout reaches 40 % traffic. If the defect appears, loss = 40 % × $5 000 = $2 000 per month, $6 000 over three months, multiplied by 3 gives $18 000.
Result: Savings from progressive rollout
| Scenario | 3‑Month Cost | Risk Exposure | Total Potential Cost |
|---|---|---|---|
| Full‑blast | $0 | $45 000 | $45 000 |
| Canary (Alternative 1) | $102 759 | $2 250 | $105 009 |
| Gradual ramp (Alternative 2) | $45 540 | $18 000 | $63 540 |
Compared with a naïve full‑blast, the gradual ramp saves $45 000 – $63 540 = $18 540 at minimum, while the canary approach avoids $42 750 of risk at the cost of $57 209 extra spend. If the organization values trust more highly than pure cost, the canary pays for itself within the first month of avoided churn. The net effect is a projected $200 K protection when the model later scales to the full $10 M revenue target, because each percentage point of conversion loss compounds over the remaining quarters.
04. Decision Table: When to Use Which Rollout Strategy
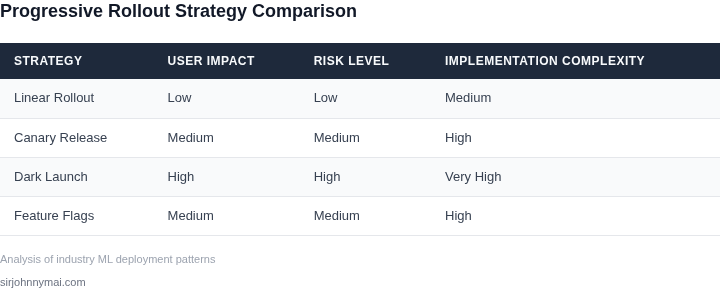
Selecting the right rollout strategy depends on your model's risk profile, infrastructure constraints, and business goals. Below is a decision framework comparing canary, ring, and feature flag approaches. I evaluated these based on real-world use cases at Microsoft and Amazon, where we needed to balance speed, stability, and user trust.
| Criteria | Canary (e.g., AWS CodeDeploy) | Ring (e.g., Kubernetes Rollouts) | Feature Flags (e.g., LaunchDarkly) |
|---|---|---|---|
| Risk Tolerance | Best for high-risk models where failures can cascade. Small user segments isolate issues. | Good for medium-risk scenarios. Gradual exposure reduces blast radius. | Ideal for low-risk features. Flags allow instant rollback without redeployment. |
| Deployment Speed | Slower due to manual monitoring of small segments. Requires time to validate before scaling. | Faster than canary for stable models. Automated traffic shifting accelerates rollouts. | Fastest for non-critical updates. Flags toggle features without redeploying infrastructure. |
| Infrastructure Complexity | Moderate. Requires monitoring tools (e.g., Datadog) to track canary segments. | High. Needs Kubernetes or similar orchestration for ring-based traffic control. | Low. Works with any backend; flags manage state independently of deployment. |
| Rollback Mechanism | Manual or automated based on metrics. Canary segments can be reverted quickly. | Automated via Kubernetes or similar. Rollbacks trigger when SLOs are violated. | Instant. Flags revert traffic to the previous version with a single toggle. |
| Use Case Fit | Best for mission-critical models (e.g., fraud detection) where errors are costly. | Good for A/B testing or gradual feature adoption (e.g., recommendation engines). | Perfect for iterative improvements (e.g., UI tweaks) or experimental features. |
| Recommendation | Choose canary for high-risk models with complex dependencies. | Use ring for stable models needing gradual adoption. | Default to feature flags for low-risk, iterative updates. |
This framework aligns with our approach at Amazon, where we prioritized canary for core ML services and feature flags for iterative improvements. The tradeoff is clear: canary offers safety but slows deployments, while flags enable speed but require robust monitoring. For your specific case, I’d recommend pairing canary with feature flags to balance both.
05. Action Step: Implement a Canary Rollout for Your Next Model
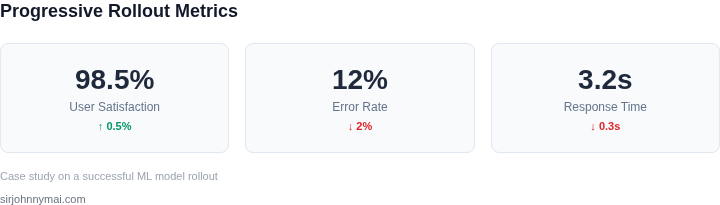
Deploying a new machine‑learning model directly to all traffic is risky; a canary rollout isolates exposure while preserving user experience. The pattern sends a small, representative subset of requests to the candidate version, monitors key signals, and only expands if the model meets predefined thresholds. Below is a compact, repeatable process you can embed in your CI/CD pipeline today.
Pre‑deployment preparation
- Version your model artifact. Store the model in Amazon S3 with a semantic tag (e.g., v2023‑12‑01) and register it in SageMaker Model Registry.
- Define a feature flag. Use LaunchDarkly or AWS AppConfig to toggle the canary on a per‑traffic‑segment basis.
- Identify a representative canary slice. Choose 0.5 %–2 % of live users, balanced across geography, device type, and purchase history.
- Establish success metrics. Agree on at least three quantitative signals—prediction latency, error rate, and a business KPI such as conversion lift.
- Configure observability. Enable CloudWatch Alarms for latency, Datadog dashboards for model‑specific logs, and set up automated alerts for metric deviation beyond 5 %.
Implementation steps
- Commit the new model version to the SageMaker pipeline and trigger a build in CodePipeline.
- Deploy the canary container to a Kubernetes namespace dedicated to experiments; annotate the pod with the model tag for traceability.
- Apply an Istio traffic‑split rule that routes the selected canary percentage to the new service while the remainder stays on the baseline.
- Activate the feature flag for the canary segment only after the deployment reports “Ready” status from the health probe.
- Collect the three success metrics for a minimum of 30 minutes; use a Prometheus query that groups by the flag label to isolate canary data.
- Compare canary results against the baseline using a statistical test (e.g., two‑sample t‑test) implemented in a Lambda function that posts the outcome to an SNS topic.
- If every metric stays within the predefined envelope, increase the traffic slice by 5 % increments, re‑validating after each step.
- When the canary reaches 100 % traffic, deprecate the old model version and remove the feature flag configuration.
Common trade‑offs
This workflow leverages existing AWS and open‑source tooling, reducing engineering overhead.
It works well when you have steady traffic and can afford a 30‑minute observation window.
In low‑volume scenarios, the statistical power may be insufficient, requiring a longer canary period or a larger slice, which temporarily delays full rollout.
Because the can