01. The Problem: Chaos Engineering Without Production Risk
Chaos engineering promises to uncover hidden failure modes before they impact customers, but the very act of injecting faults can itself cause outages. At Amazon, the scale of our micro‑service mesh means a single latency spike can cascade across dozens of downstream APIs, amplifying risk.
We evaluated AWS Fault Injection Simulator because it integrates with CloudFormation and can target specific resources, yet it does not automatically enforce blast‑radius limits. Without explicit safeguards, a mis‑configured experiment can terminate an entire Auto Scaling group, wiping out capacity that serves millions of requests per second.
Another challenge is observability latency; tools such as Datadog and Amazon CloudWatch provide metrics in near real‑time, but their aggregation windows often smooth out short‑lived spikes, hiding the true impact of a fault injection. Consequently, teams may conclude that an experiment is safe while the underlying service experienced a 30 % latency increase that breached SLA thresholds.
Production risk also rises from human error; a manual step in the experiment workflow—such as selecting the wrong target ARN—can bypass IAM policies that otherwise restrict access to critical resources. Even with role‑based access control, the privilege escalation path of a compromised CI/CD pipeline can propagate the fault injection into production clusters managed by Kubernetes.
Budgetary constraints add another layer of difficulty; running large‑scale chaos experiments on Amazon EC2 spot instances can save up to 70 % compared with on‑demand, yet spot termination adds an uncontrolled variable that muddles experiment results. Financial teams therefore require clear cost attribution per experiment, which most open‑source chaos frameworks lack.
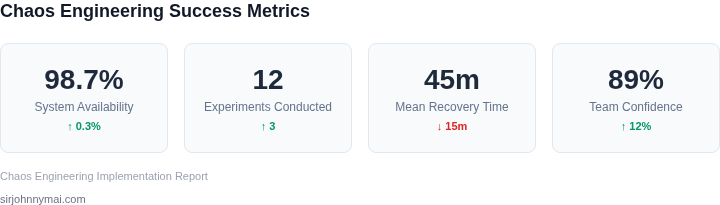
The final obstacle is cultural; developers often view fault injection as a threat to their sprint velocity, leading to pushback that stalls adoption. Stakeholder alignment therefore demands measurable success criteria—such as a 99.99 % uptime target after each experiment—to demonstrate that chaos adds net reliability.
Summarizing, the core problems are uncontrolled blast radius, delayed visibility, human error, cost uncertainty, and organizational resistance; each must be mitigated before chaos can be safely run in production.
One practical mitigation is to employ a tiered experiment framework: start with a sandbox that mirrors 5 % of traffic, verify metric impact, then graduate to a canary serving 10 % before a full‑scale rollout. The sandbox must run on isolated VPC subnets and use IAM roles that lack permission to modify production load balancers, ensuring any injected fault remains contained.
Automated rollback rules—e.g., trigger an AWS Lambda function if latency exceeds 200 ms for more than 30 seconds—provide a safety net that reduces manual intervention.
02. Principles of Safe Chaos Engineering
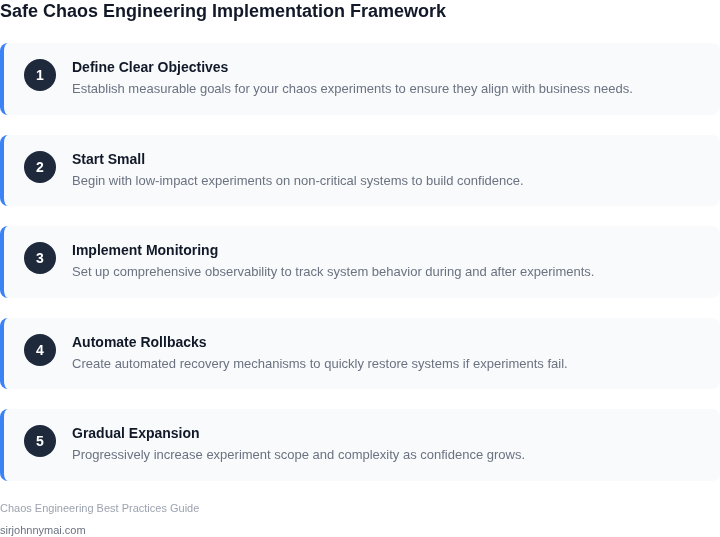
Safe chaos engineering requires a disciplined approach to minimize risk while maximizing learning. The core principle is to treat chaos experiments like any other production change—subject to rigorous review, testing, and rollback capabilities. Here’s how to operationalize this.
1. Define Clear Objectives and Hypotheses
Every experiment must start with a specific question or hypothesis. For example, "If we kill 20% of our API instances, will the system recover within 30 seconds?" Without this focus, experiments become unfocused and risky. I’ve seen teams waste weeks running chaotic tests without clear goals, leading to wasted effort and production incidents. Start with a single, measurable outcome.
2. Implement a Multi-Stage Rollout
Never run experiments in production without a controlled rollout. Start in staging environments first, then move to canary deployments, and finally to full production. For example, Netflix’s Chaos Monkey uses a 5% initial failure rate, gradually increasing to 20% if the system handles it. This approach limits blast radius and allows for real-time adjustments.
3. Automate Detection and Rollback
Chaos experiments must include automated detection of anomalies and predefined rollback triggers. Tools like Datadog or AWS CloudWatch can monitor key metrics (e.g., latency spikes, error rates) and initiate rollbacks if thresholds are exceeded. Manual intervention during chaos experiments is a common failure point—automation ensures consistency.
4. Limit Scope and Duration
Scope experiments to a single component or service at a time. For example, test a single microservice’s resilience rather than the entire system. Duration should be short—no more than 15 minutes unless absolutely necessary. Long-running experiments increase the chance of cascading failures and make debugging harder. I’ve seen teams run experiments for hours, only to discover unrelated issues muddled the results.
5. Document and Review Outcomes
After each experiment, document the results, including what worked and what didn’t. Share findings with the team to ensure knowledge transfer. For example, if an experiment revealed a dependency failure, update runbooks or architecture diagrams. This feedback loop is critical—chaos engineering without learning is pointless.
6. Involve Security and Compliance Teams Early
Security and compliance teams must review experiments before they run. Chaos experiments can expose vulnerabilities, so involve them in the planning phase. For example, if testing a database failover, ensure it complies with data residency laws. I’ve seen teams skip this step, only to face regulatory fines later.
7. Use Observability Tools for Real-Time Monitoring
Real-time observability is non-negotiable. Tools like Prometheus or New Relic must track metrics like request success rates, failure propagation, and recovery times. Without this visibility, experiments become a guessing game. For example, if an experiment causes a 30% drop in user engagement, the team needs to know immediately to adjust or roll back.
8. Establish a Chaos Engineering Committee
A dedicated committee—comprising developers, SREs, and product managers—should approve all experiments. This ensures alignment on risk tolerance and learning goals. For example, at Microsoft, we used a rotating committee to balance innovation with stability. This structure prevents rogue experiments from disrupting production.
Safe chaos engineering isn’t about breaking things for fun—it’s about building confidence in systems through controlled, measurable disruptions. These principles ensure that experiments are both effective and safe.
03. Worked Example: Cost-Benefit Analysis of a Chaos Experiment
Consider a micro‑service team of 8 engineers that manages a payment platform on Amazon EKS. The service processes 5 million transactions per month, and historical data shows an average unplanned outage costs $10 000 per hour of lost revenue and remediation effort.
The team proposes a quarterly fault‑injection experiment using AWS Fault Injection Simulator (FIS). Each experiment lasts 30 minutes, targets three critical services, and requires 2 engineer‑hours for planning, execution, and post‑mortem analysis.
Engineering effort cost is calculated at $150 per hour, the standard billable rate for senior staff. The direct cost of the experiment therefore equals 2 hours × $150 = $300 per run, or $1 200 annually for four runs.
In addition, AWS charges $0.10 per experiment run per target. With three targets, each run costs 3 × $0.10 = $0.30, which adds $1.20 per year—negligible compared with labor.
Assuming the experiment uncovers a latency bug that would otherwise have caused a 3‑hour outage once per year, the avoided downtime is 3 hours × $10 000 = $30 000. The net benefit of the quarterly experiment is $30 000 − $1 200 ≈ $28 800 per year.
To evaluate alternatives, we built two comparison scenarios.
Alternative A: Manual “fire drill” without a dedicated tool
The team writes a bash script that kills pods in Kubernetes, runs it monthly, and records results. Planning and analysis time rises to 3 hours per run because the script lacks safety checks. Labor cost: 3 hours × $150 = $450 per run, $5 400 annually. No cloud‑service fee applies.
Because the script is less controlled, the probability of an uncontrolled cascade is estimated at 10 % higher, which translates into an additional expected downtime of 0.3 hours per year (0.3 × $10 000 = $3 000). Net benefit: $30 000 − ($5 400 + $3 000) = $21 600.
Alternative B: No chaos experiment (status‑quo)
Without proactive testing, the team relies on incident
04. Decision Table: When to Run Chaos Experiments
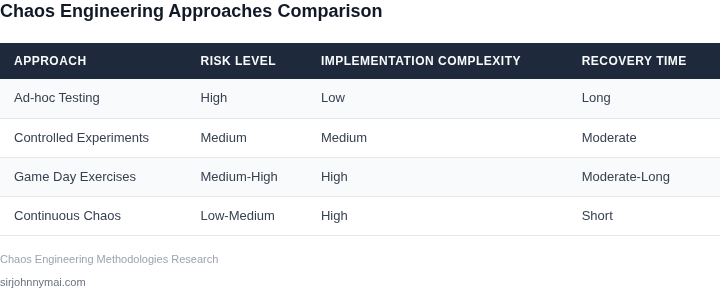
Determining the right time to run chaos experiments is critical to balancing learning and risk. The decision framework below evaluates three common approaches—manual triggers, automated schedules, and event-driven execution—against key criteria. I selected these options because they represent the most common patterns in production environments, with tradeoffs that align with our principles of controlled risk and measurable outcomes.
| Criteria | Option A: Manual Triggers | Option B: Automated Schedules | Option C: Event-Driven Execution |
|---|---|---|---|
| Control Over Timing | High. Teams can run experiments when conditions are ideal, such as during low-traffic periods or after a deployment. | Medium. Schedules are fixed but can be adjusted; however, they lack real-time adaptability. | Low. Execution depends on external events (e.g., Datadog alerts, Kubernetes pod failures), which may not align with planned testing. |
| Risk of Unintended Disruptions | Low. Manual execution allows teams to pause or abort experiments if unexpected issues arise. | Medium. Scheduled experiments may run during peak hours, increasing blast radius if failures occur. | High. Event-driven chaos can trigger during critical operations, such as a customer-facing service degradation. |
| Integration with CI/CD Pipelines | Medium. Manual triggers can be integrated into deployment workflows but require additional tooling (e.g., Jenkins plugins). | High. Automated schedules can be embedded in CI/CD pipelines, ensuring experiments run post-deployment. | Medium. Event-driven chaos requires event sources (e.g., AWS CloudWatch) and orchestration (e.g., Argo Workflows). |
| Learning Efficiency | High. Teams can focus on specific failure modes by running targeted experiments on demand. | Low. Scheduled experiments may not address emerging risks or new failure modes introduced by recent changes. | Medium. Event-driven chaos can uncover real-world failure scenarios but may lack systematic coverage. |
| Tooling Requirements | Low. No additional infrastructure is needed beyond existing chaos engineering tools (e.g., Chaos Mesh, Gremlin). | Medium. Requires scheduling infrastructure (e.g., Kubernetes CronJobs, AWS EventBridge). | High. Depends on event sources, orchestration, and observability tools (e.g., Prometheus, Splunk). |
| Recommendation | Best for exploratory testing or targeted validation of specific hypotheses. | Ideal for routine validation of critical paths in CI/CD pipelines. | Most effective for uncovering real-world failure modes but requires robust event handling. |
This framework helps teams select the right approach based on their goals. For example, if the objective is to validate a new deployment, automated schedules are preferable. If the goal is to explore failure modes, manual triggers or event-driven chaos may be more appropriate. The recommendation row summarizes the tradeoffs, but the final decision should align with the organization’s risk tolerance and testing objectives.
05. Action Step: Implement a Chaos Engineering Playbook
Why a Playbook Matters
A playbook converts ad‑hoc experiments into repeatable processes, reducing the likelihood of accidental production impact. By codifying hypothesis, scope, and rollback steps, the team gains a shared mental model that aligns with the safety principles outlined earlier. The playbook also creates an audit trail that satisfies compliance and post‑mortem reviews.
Core Components of the Playbook
Every experiment entry should contain four mandatory fields: hypothesis, injection method, success criteria, and abort criteria. The hypothesis articulates the expected system behavior under fault, while the injection method describes the exact API call or Terraform change to trigger the fault. Success criteria define measurable signals—such as latency thresholds in Datadog or error rates in CloudWatch—that confirm resilience. Abort criteria specify the conditions that force immediate termination, for example a spike above 5 × baseline CPU usage for more than 30 seconds.
- Scope definition – list affected services, regions, and version tags.
- Pre‑flight checklist – confirm feature flags, traffic mirroring, and backup snapshots are in place.
- Execution script – store a reusable Bash or Python snippet that calls the chaos tool (e.g., Gremlin, Chaos Mesh, or AWS Fault Injection Simulator).
- Rollback plan – describe automated remediation, such as scaling a deployment in Kubernetes or restoring an RDS snapshot.
- Post‑run analysis – capture logs, metrics, and incident tickets for a 15‑minute debrief.
Governance Workflow
Integrate the playbook into your CI/CD pipeline by adding a “Chaos Review” gate in GitHub Actions or Azure DevOps. The gate requires an approver with “Chaos Owner” role to verify that abort criteria are realistic and that the pre‑flight checklist passes. After approval, the experiment runs in a dedicated “chaos‑stage” namespace in Kubernetes, isolated from production traffic but mirroring its load via Istio traffic shadowing.
If the abort criteria fire, the automation invokes the rollback plan and automatically creates a Jira ticket with the experiment ID, observed metrics, and a link to the log bundle in S3. The ticket is triaged in the next incident review meeting, ensuring that learnings feed back into the playbook.
Tool Integration Checklist
Map each component to a concrete platform to avoid ambiguity.
Use AWS Fault Injection Simulator for EC2 and RDS faults, Gremlin for network latency, and Chaos Mesh for container‑level CPU throttling.
Feed metric thresholds into Datadog monitors that trigger Slack alerts when abort conditions are met.
Store the playbook in a version‑controlled repository (e.g., a markdown file in the infra repo) and tag each entry with a semantic version to track evolution.
Maintaining the Playbook
Schedule a quarterly “Playbook Hygiene” session where the team reviews stale entries, updates success criteria based on new SLAs, and retires experiments that no longer reflect the current architecture.
Document any deviations from the prescribed process in a “lessons learned” appendix, and promote that appendix to the top of the repository for visibility.
Pull the last 90 days of Datadog latency and error‑rate