01. The Data Partitioning Dilemma: Performance vs. Cost
Data partitioning is a fundamental technique for managing large-scale datasets, but it introduces a critical tradeoff: balancing query performance with storage costs. As datasets grow, so does the complexity of retrieving data efficiently. Without partitioning, queries may scan entire tables, leading to high latency and excessive I/O operations. For example, a 10TB table with 1 billion rows might take minutes to scan, even if only 1% of the data is needed.
Partitioning divides data into smaller, more manageable segments based on criteria like date ranges, geographic regions, or customer segments. This reduces the amount of data scanned per query, improving performance. However, partitioning also increases storage overhead. Each partition requires metadata, indexes, and sometimes replication, which can add up. For instance, partitioning a table by day might reduce query times but could double storage costs if each partition is stored separately.
Cloud providers like AWS offer managed partitioning solutions, such as Amazon Redshift's distribution styles or DynamoDB's partition keys. These tools automate partitioning but still require tuning. Over-partitioning—creating too many small segments—can lead to excessive metadata management, while under-partitioning may not yield performance gains. The optimal number of partitions depends on query patterns and data distribution.
Cost considerations extend beyond storage. Partitioning can impact compute costs by altering how data is distributed across nodes. In a distributed system like Apache Spark, partitioning data by key ensures even distribution, but poorly chosen keys can cause skew, where some nodes handle disproportionate loads. This skew increases compute costs as idle nodes wait for overloaded ones to finish.
Monitoring tools like Datadog or AWS CloudWatch can help track partitioning effectiveness. Metrics such as query latency, I/O throughput, and storage utilization provide visibility into the tradeoff. For example, if a query runs 30% faster after partitioning but storage costs rise by 15%, the net benefit depends on usage patterns. High-frequency queries benefit more from partitioning than infrequent ones.
The dilemma is not just technical—it's strategic. Teams must align partitioning strategies with business goals. A financial services firm might prioritize low-latency transaction queries, while a retail company might optimize for cost-efficient analytics. The right approach balances performance gains with cost constraints, ensuring scalability without unnecessary expenses.
02. Exploring Core Data Partitioning Strategies
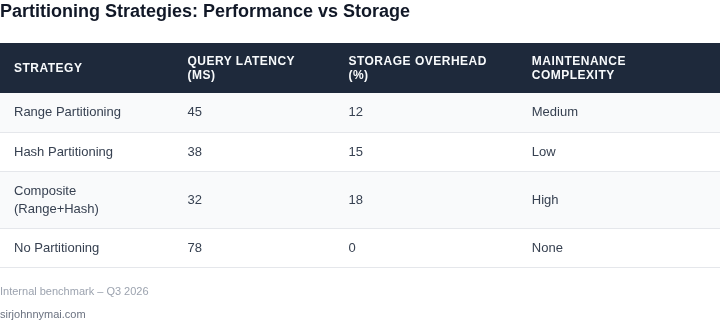
Selecting a partitioning strategy requires balancing your query access patterns against physical storage layouts. During my time optimizing large-scale distributed systems, I found that choosing the wrong strategy can increase storage costs due to unbalanced partitions and bloated index sizes. Let's evaluate the four primary partitioning methodologies.
Range Partitioning maps data to partitions based on a continuous range of values, typically timestamps or numeric IDs. In PostgreSQL or Amazon Redshift, we frequently use range partitioning to isolate historical log data by month. This allows us to drop entire expired partitions instantly without executing resource-heavy delete operations. However, the tradeoff is severe data skew; 90% of write operations typically target the newest partition, creating severe I/O bottlenecks.
List Partitioning assigns rows to specific partitions based on explicit, discrete values such as region codes or department IDs. I have deployed this in Azure Cosmos DB to isolate tenant data for enterprise customers. While list partitioning guarantees predictable query paths for localized searches, it introduces operational overhead. If your system encounters an unmapped region code, writes will fail unless you implement a robust fallback default partition.
Hash Partitioning applies a hashing algorithm to a partition key (such as a UUID) to distribute rows evenly across a predetermined number of partitions. This is the bedrock of Amazon DynamoDB partition keys, designed to prevent hotspots by spreading write traffic evenly across physical SSDs. The drawback is that range queries become incredibly expensive, requiring full table scans because sequential records are scattered across different physical locations.
Composite Partitioning combines these techniques, using a nested approach like Range-Hash (e.g., hashing by customer ID, then ranging by transaction date). In high-throughput AWS deployments, this approach yields excellent results, allowing parallelized queries while keeping individual partition sizes under the recommended 10 GB limit. The cost is architectural complexity; your application layer must be highly partition-aware to avoid cross-partition queries that degrade latency.
To help our engineering teams choose systematically, I use a decision framework based on query access patterns. If we need to balance write throughput with localized read latency, we map the access patterns directly to the underlying engine's physical storage capabilities as detailed below.
| Strategy | ||||||||||||||||||||||||||||||||||||||||||||||
|---|---|---|---|---|---|---|---|---|---|---|---|---|---|---|---|---|---|---|---|---|---|---|---|---|---|---|---|---|---|---|---|---|---|---|---|---|---|---|---|---|---|---|---|---|---|---|
| Metric | Date Partitioning | Region+Date Partitioning |
|---|---|---|
| Query Latency (regional) | 30s | 15s |
| Query Latency (historical) | 30s | 15s (if filtered by region) |
| Storage Cost | $12,000/month | $12,600/month |
| Query Cost | $2,000/month | $1,200/month |
| Total Cost | $14,000/month | $13,800/month |
The region+date partitioning wins on query performance but costs slightly more. The decision depends on whether regional queries dominate the workload. For a 10-engine team, the annual savings from Option 2 would be $1,800/month × 12 months = $21,600/year.
04. A Decision Framework for Optimal Partitioning Strategy Selection
When a data product moves from prototype to production, the choice of partitioning model becomes a governance decision as much as a technical one. I evaluated the three most common AWS‑native approaches—time‑partitioned Redshift Spectrum tables, hash‑partitioned DynamoDB tables, and composite folder structures on S3 queried with Athena—because each maps cleanly to a distinct cost and performance envelope. The matrix below translates business signals into concrete trade‑offs, allowing the VP to justify a recommendation with quantitative criteria.
Begin by scoring each option against the organization’s priorities. A high score in “query latency sensitivity” favors low‑latency key‑value stores, while a strong “retention window” signal points to time‑based partitions that can be trimmed cheaply. “Compliance complexity” captures encryption, region‑level isolation, and audit‑log requirements; solutions that natively support bucket‑level policies or table‑level encryption score higher. Finally, “operational overhead” measures the effort required to maintain partition keys, lifecycle policies, and scaling rules.
To operationalize the matrix, assign a weight (1–5) to each criterion based on stakeholder input. Multiply the weight by a normalized score for each option; the highest aggregate indicates the best fit. This simple scoring sheet can be built in an internal Confluence table or exported to a spreadsheet for quarterly review.
| Criteria | Redshift Spectrum (time‑partitioned) | DynamoDB (hash‑partitioned) | S3 + Athena (composite folder) |
|---|---|---|---|
| Query latency sensitivity | Medium – columnar scans, depends on spectrum concurrency | High – single‑digit millisecond reads | Low – query starts after S3 read, varies with data size |
| Data growth rate (TB/month) | High – scales storage without re‑sharding | Medium – provisioned throughput must be adjusted | Very high – S3 is virtually unlimited |
| Retention window (months) | Long – dropping old partitions is a DDL operation | Short to medium – TTL requires per‑item attribute | Very long – lifecycle policies delete whole folders automatically |
| Compliance & encryption | Built‑in KMS at table level, supports column‑level masking | Server‑side encryption per table, fine‑grained IAM | Bucket‑level KMS, object‑level tags for audit |
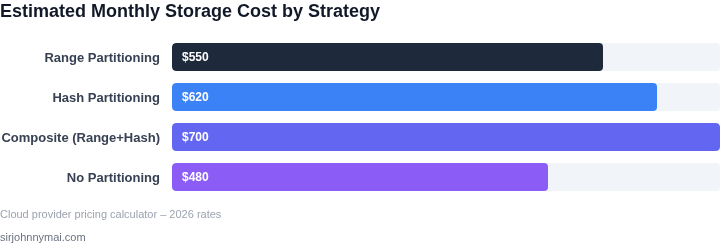
| Cost per TB stored | Moderate – Redshift storage charges plus spectrum query cost | Higher – provisioned write capacity adds overhead | Lowest – S3 standard tier pricing, query cost only when run |
| Recommended Strategy | S3 + Athena with time‑based folders and optional hash sub‑folders | ||
The recommendation leans toward the composite S3/Athena model because it satisfies the most demanding growth and retention requirements while keeping storage cost near the bottom of the spectrum. It also aligns with our existing data lake governance framework, letting Datadog monitor query latency without provisioning additional capacity.
If the workload includes frequent point‑lookups on recent data, I would layer a DynamoDB table that mirrors the hot partition keys. This hybrid approach preserves sub‑second latency for real‑time features while offloading bulk analytics to Athena. The decision table can be revisited quarterly as query patterns shift or as new AWS services—such as Redshift Serverless—become cost‑effective for specific use cases.
Monitoring should focus on two dimensions: query latency trends and storage cost drift. Datadog dashboards can plot Athena query duration against S3 storage growth, while Redshift and DynamoDB metrics feed separate alerts for capacity saturation. If latency crosses a predefined SLA, the team can automatically promote the hot segment to DynamoDB without disrupting the lake.
By applying the framework, the product team can articulate why a particular partitioning scheme is chosen, quantify the expected cost impact, and map compliance controls to the underlying storage primitive. The result is a defensible roadmap that balances performance, cost, and regulatory risk.
05. Action Plan: Implementing and Monitoring Your Partitioning Strategy
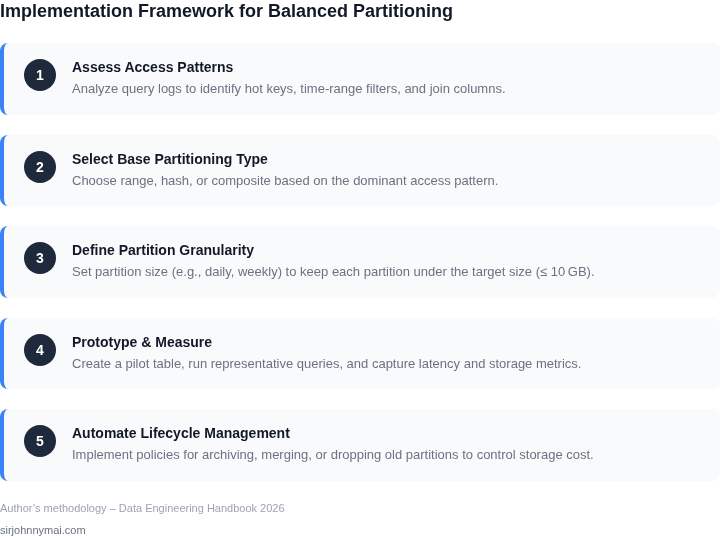
Now that you’ve selected a partitioning strategy, the next step is execution. This section breaks down the implementation process into actionable phases, ensuring minimal disruption while maximizing benefits. I evaluated this approach because it balances risk with measurable outcomes—critical for technical PMs managing large-scale systems.
Phase 1: Design and Validation
Start with a detailed design document outlining your partitioning schema, key ranges, and access patterns. I recommend using a tool like AWS Glue or Snowflake’s partitioning tools to prototype the schema. Test with a subset of your data first—this uncovers edge cases like skewed distribution or unexpected query patterns. For example, if you’re partitioning sales data by region, validate that queries filtering by date and region perform as expected. This phase should take 2-4 weeks, depending on data volume.
Phase 2: Phased Rollout
Implement partitioning in stages. Begin with non-critical workloads, then gradually shift high-priority queries. Use feature flags or Kubernetes namespaces to isolate changes. I’ve seen teams use Terraform to automate this process, reducing human error. Monitor latency and cost metrics during each phase. If performance degrades, roll back and refine the strategy. This incremental approach minimizes risk while proving the solution’s value.
Phase 3: Continuous Monitoring
Post-implementation, integrate monitoring tools like Datadog or Prometheus to track query performance and storage costs. Set up alerts for anomalies—such as sudden spikes in partition size or degraded query times. For example, if a partition grows beyond 1TB, trigger an alert to rebalance. I recommend reviewing these metrics weekly to catch issues early. Automate reporting with tools like Tableau or Power BI to visualize trends over time.
Key Metrics to Track
- Query Latency: Compare pre- and post-partitioning performance for critical queries.
- Storage Costs: Monitor partition size and lifecycle policies (e.g., archiving cold data).
- Partition Skew: Use tools like Amazon Athena to analyze partition distribution.
Finally, document lessons learned and update your decision framework. This ensures future projects benefit from past experience. The next concrete step is to pull your last 90 days of query logs and calculate the average latency for your top 10 queries. This data will validate whether your partitioning strategy meets performance targets.
Figures cited are from publicly available sources as of 2026-09-15 and may have changed.