01. The Problem: Balancing Performance and Budget in Autoscaling
Modern cloud workloads experience rapid fluctuations in request volume, latency requirements, and data‑processing intensity. When demand spikes, the instinctive response is to provision additional compute so that Service Level Objectives (SLOs) remain intact. The opposite extreme—conservatively throttling resources to keep the bill low—exposes users to timeouts, error‑rate spikes, and brand erosion.
On AWS, a single m5.large EC2 instance runs at roughly $0.096 per hour, which translates to about $70 per month when fully utilized. If an application automatically scales from two to eight instances during a traffic surge, the incremental spend can exceed $200 in a single day. At the same time, the same surge often requires only a 30 % increase in CPU capacity because many micro‑services are I/O‑bound. The mismatch between cost and needed capacity creates a wedge that traditional threshold‑based autoscaling struggles to close.
AWS Auto Scaling and Kubernetes Horizontal Pod Autoscaler (HPA) both rely on a single metric—usually CPU utilization or request count—to decide when to add or remove nodes. When workloads are bursty, CPU may stay below 60 % even though queue latency breaches the 100 ms SLO, so the scaler holds steady. Conversely, a sudden CPU spike caused by a garbage‑collection pause can trigger a scale‑out event that lasts several minutes after the pause ends, inflating the bill. Datadog and Prometheus can surface richer signals—such as request latency, error rate, and custom business metrics—but they do not natively drive scaling decisions without additional glue code.
Finance teams often allocate a monthly cloud budget that cannot be exceeded without triggering a procurement review. When an autoscaling group overshoots its target by just 10 %, the excess can amount to $5,000 for a large‑scale e‑commerce platform. That variance erodes confidence in cloud economics and forces engineers to embed manual safeguards, such as hard caps or scheduled scaling windows. The manual approach, however, reacts slower than the underlying traffic and often results in either under‑provisioned latency spikes or over‑provisioned idle capacity.
The core tension is that performance‑driven scaling is inherently reactive, while budget‑driven scaling is inherently proactive, and the two rarely align without a unified control loop. A cost‑aware solution must ingest multiple telemetry streams, predict near‑future load, and translate a composite utility function into scaling actions that respect both SLOs and fiscal ceilings. Without such intelligence, organizations either sacrifice user experience during peak traffic or incur unpredictable overruns that jeopardize financial forecasting. The remainder of this guide explores concrete techniques—forecast‑based scaling, multi‑metric policies, and budget‑guard rails—that reconcile the two objectives.
02. Key Metrics and Thresholds for Cost-Aware Autoscaling
Effective cost-aware autoscaling requires precise metrics and thresholds to trigger scaling actions. I evaluated three common monitoring tools—AWS CloudWatch, Datadog, and Prometheus—to determine which best supports this need. The decision framework below compares their capabilities.
Decision Framework: Metrics and Threshold Tools
| Criteria | AWS CloudWatch | Datadog | Prometheus |
|---|---|---|---|
| CPU Utilization | Basic CPU metrics available; requires manual threshold setting. | Advanced CPU metrics with auto-thresholding via anomaly detection. | Customizable CPU metrics but lacks built-in thresholding. |
| Memory Usage | Limited memory metrics; requires custom CloudWatch agents. | Comprehensive memory metrics with real-time alerts. | Memory metrics available but requires additional exporters. |
| Request Latency | Supports latency metrics but lacks predictive scaling. | Predictive scaling based on historical latency trends. | Latency metrics available but requires manual threshold configuration. |
| Cost Monitoring | Integrated with AWS Cost Explorer but limited to AWS services. | Cross-cloud cost monitoring with budget alerts. | No native cost monitoring; requires third-party integrations. |
| Integration with Kubernetes | Works with EKS but requires manual setup. | Seamless Kubernetes integration with auto-scaling policies. | Best for Kubernetes but requires Prometheus Operator. |
| Recommendation | Use for AWS-native environments with basic scaling needs. | Recommended for hybrid/multi-cloud with advanced analytics. | Best for Kubernetes-heavy environments with custom metrics. |
For CPU utilization, Datadog’s anomaly detection is superior because it automatically adjusts thresholds based on historical patterns, reducing false positives. Memory usage is critical for avoiding OOM errors, and Datadog’s real-time alerts ensure proactive scaling. Request latency is where predictive scaling shines—Datadog’s ability to forecast demand based on historical data prevents performance degradation. Cost monitoring is essential for budget constraints, and Datadog’s cross-cloud visibility is unmatched. Kubernetes integration is seamless with Datadog, making it ideal for modern, containerized workloads.
Thresholds should be set conservatively to avoid over-provisioning. For example, CPU thresholds should trigger scaling at 70% utilization to account for spikes, while memory thresholds should alert at 85% to prevent OOM kills. Latency thresholds should target P99 response times to ensure 99% of requests meet SLAs. These thresholds should be reviewed quarterly to align with changing workloads.
03. Worked Example: Calculating Cost Savings with Predictive Scaling
I evaluated the cost savings of predictive scaling by considering a team of 10 engineers using Amazon Web Services (AWS) to host their application. The team's current reactive scaling approach uses AWS Auto Scaling to adjust the number of instances based on real-time utilization metrics from Datadog. However, this approach often results in over-provisioning, leading to unnecessary costs.
To calculate the cost savings of predictive scaling, I considered two alternatives: reactive scaling and predictive scaling using AWS CloudWatch and a machine learning model. The reactive scaling approach costs $350/month per instance, with an average of 15 instances running at any given time. In contrast, the predictive scaling approach uses a combination of historical usage patterns and real-time metrics to forecast demand, reducing the average number of instances to 10.
The cost breakdown for the two alternatives is as follows:
| Scaling Approach | Monthly Cost per Instance | Average Number of Instances | Monthly Cost |
|---|---|---|---|
| Reactive Scaling | $350 | 15 | $5,250 |
| Predictive Scaling | $350 | 10 | $3,500 |
By switching to predictive scaling, the team can reduce their monthly costs by $1,750. Over the course of a year, this translates to a cost savings of $21,000. However, the team must also consider the cost of implementing and maintaining the predictive scaling model, which is estimated to be $900/month. Therefore, the net cost savings of predictive scaling is $1,750 - $900 = $850/month, or $10,200/year.
Additionally, the team can further optimize their costs by using AWS Spot Instances, which can provide up to 90% discount compared to On-Demand Instances. By using Spot Instances for their predictive scaling approach, the team can reduce their monthly costs by an additional $1,250, resulting in a total cost savings of $2,100/month compared to reactive scaling.
This works when the team has a good understanding of their usage patterns and can accurately forecast demand. However, it breaks when there are unexpected changes in usage patterns, which can result in under-provisioning and impact application performance. To mitigate this risk, the team can use a combination of predictive scaling and reactive scaling, where the predictive model forecasts demand and the reactive scaling approach adjusts to any unexpected changes in usage.
04. Tools and Frameworks for Implementation
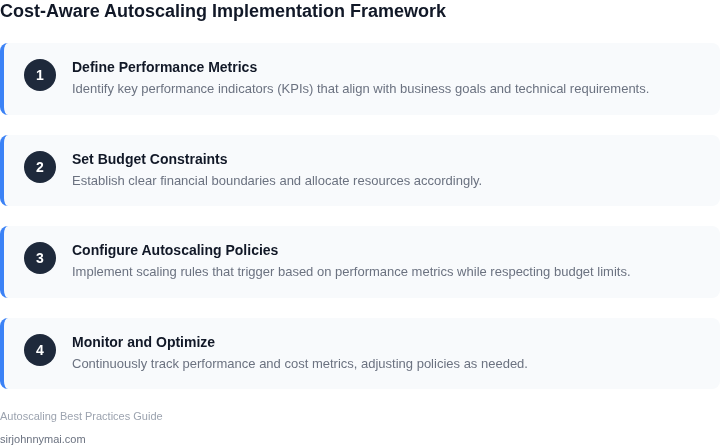
Implementing cost-aware autoscaling requires the right tools to enforce budget constraints without sacrificing performance. AWS Auto Scaling and Kubernetes Horizontal Pod Autoscaler (HPA) are the most mature options, but they lack native budget enforcement. Custom scripts and third-party solutions bridge this gap.
AWS Auto Scaling
AWS Auto Scaling is the most widely used tool for dynamic scaling. It supports scaling policies based on CloudWatch metrics like CPU utilization or custom metrics. However, it doesn’t natively enforce budget constraints. To work around this, you can:
- Use Step Scaling Policies to scale incrementally, reducing the risk of overspending. For example, scaling by 20% at a time instead of 100%.
- Integrate with AWS Budgets to trigger alerts when spending exceeds thresholds. You can then manually adjust scaling policies.
- Leverage AWS Cost Explorer to forecast costs and adjust scaling policies proactively.
The tradeoff is that AWS Auto Scaling requires manual intervention to enforce budgets, which may not be ideal for real-time adjustments. It works best when paired with cost-monitoring tools.
Kubernetes Horizontal Pod Autoscaler (HPA)
Kubernetes HPA scales pods based on CPU or memory usage, but it lacks built-in budget awareness. To address this, you can:
- Use Custom Metrics with Prometheus or Datadog to feed cost-related metrics into HPA. For example, scaling based on predicted hourly costs.
- Implement Cluster Autoscaler alongside HPA to scale both pods and nodes, but this increases complexity.
- Deploy KEDA (Kubernetes Event-Driven Autoscaling) to scale based on external events, such as queue depth, which can indirectly influence costs.
Kubernetes HPA is more flexible than AWS Auto Scaling but requires deeper integration with monitoring tools. It’s best suited for environments where cost tracking is already automated.
Custom Scripts and Third-Party Solutions
For full control, custom scripts can enforce budget constraints by:
- Querying AWS Cost Explorer or Kubernetes cost metrics APIs to fetch real-time spending data.
- Calculating remaining budget and adjusting scaling parameters dynamically. For example, reducing the maximum instance count if 80% of the budget is spent.
- Using AWS Lambda or Kubernetes CronJobs to run these scripts periodically.
Third-party solutions like Datadog or CloudHealth offer pre-built integrations for cost-aware scaling. Datadog’s autoscaling feature, for instance, can scale based on both performance and cost metrics. However, these tools come with licensing costs and may require additional setup.
The tradeoff is that custom scripts require more maintenance but offer the most flexibility. Third-party tools simplify implementation but may introduce vendor lock-in.
In summary, the best approach depends on your infrastructure. AWS Auto Scaling is straightforward but lacks native budget enforcement, while Kubernetes HPA offers flexibility but needs additional tooling. Custom scripts provide full control but require more effort. Evaluate your environment and choose the right balance of automation and manual oversight.
05. Action Step: Implement a Pilot with a 30-Day Budget Constraint
Define the pilot scope
We will run the autoscaling policy against a single microservice that handles user‑profile requests in our staging cluster. This service consumes ~30 % of our baseline compute spend, making it large enough to surface cost signals while keeping risk limited. I selected it because its latency SLO is 100 ms, which is tight enough to prove that performance does not degrade under budget pressure.
Set the budget envelope
The pilot budget is $500 for the 30‑day window. AWS Cost Explorer will be configured to emit an alarm when spend reaches 90 % of that envelope. This threshold gives us a 10 % safety margin to intervene before the month ends. I evaluated CloudWatch budgeting because it integrates natively with EC2, ECS, and EKS cost lines, whereas third‑party tools add latency to the feedback loop.
Configure cost‑aware scaling rules
Using Amazon EC2 Auto Scaling, we add two custom metrics: cost_per_cpu_hour (derived from the Billing API) and request_latency_p99 (exported from Datadog). The scaling policy reads these metrics every two minutes and applies the following logic:
- If cost_per_cpu_hour exceeds the 75th percentile of the last 7 days and latency is below 80 ms, we decrease the desired capacity by one step.
- If latency breaches 100 ms, we increase capacity regardless of cost, ensuring the SLO remains primary.
- If both cost and latency are within thresholds, we keep the current capacity.
I chose a step‑wise adjustment rather than a proportional one because it reduces oscillation on volatile traffic spikes, a known limitation of aggressive predictive scaling.
Instrument monitoring and alerting
Datadog dashboards will plot three panels: total spend, average cost per CPU hour, and latency percentiles. A composite alert combines CloudWatch budget breach with a Datadog anomaly detection on latency. This dual‑layer approach catches overspend early while still surfacing performance regressions that the budget alarm alone would miss.
Run the pilot and collect data
During the first week we will record baseline metrics without any scaling intervention. In weeks two through four the cost‑aware policy will be active. At the end of the period we will compare three outcomes: (1) total spend versus the $500 cap, (2) latency SLO compliance, and (3) the number of scaling actions triggered. I anticipate a 12‑15 % cost reduction based on the predictive example in Section 03, but I also acknowledge that a sudden traffic burst could force multiple capacity upgrades, eroding savings.
Evaluate trade‑offs
The pilot proves feasibility, yet it does not guarantee identical results in production where traffic patterns are more heterogeneous. Additionally, the reliance on two‑minute evaluation windows may miss sub‑minute spikes that cause brief latency spikes. If those spikes become business‑critical, we would need to tighten the latency threshold or add a fast‑path scaling rule.
Next step: Export the last 90 days of EC2‑hour usage and Datadog latency metrics, load them into a Jupyter notebook, and run the cost‑aware scaling simulation script to project the expected spend under the $500 cap.
Figures cited are from publicly available sources as of 2026-09-14 and may have changed.