01. The Problem: Shared Infrastructure Costs
The data platform that supports our AI models, analytics pipelines, and robotics telemetry is built on a common set of services: Amazon S3 for object storage, Amazon Redshift for analytical queries, and a Kubernetes cluster running on Amazon EKS for compute. Each of these services incurs usage‑based charges that appear on the consolidated AWS bill. Because the same resources serve multiple product lines, the raw invoice does not reveal which business unit actually consumed the capacity.
Without a transparent attribution mechanism, finance teams resort to arbitrary split ratios that are based on headcount or historical budgets rather than real consumption. This practice inflates costs for teams that use minimal compute while penalizing groups that drive the most value from the platform. The resulting misalignment makes it difficult to justify new projects, because the cost signal is decoupled from the actual workload.
From an engineering perspective, the lack of granular cost data hampers capacity planning. When we provision additional EKS nodes, we cannot predict whether the expense will be absorbed by the robotics team or the recommendation engine team. This uncertainty leads to over‑provisioning as a safety net, which in turn drives idle EC2 instances and storage objects that sit unused for weeks.
The finance organization also struggles with audit compliance because the shared‑services bill contains line items that span multiple cost centers. Internal auditors ask for a clear mapping from each AWS usage record to a specific business unit, yet the default tagging schema only captures project‑level tags that are inconsistently applied. When tags are missing, we must resort to manual reconciliation, which consumes roughly 20 % of the monthly finance analyst headcount.
Because each business unit reports its own P&L, the inability to attribute shared‑infrastructure spend distorts profitability metrics. A unit that appears to run a lean operation may actually be subsidizing another unit’s heavy data‑science workloads, skewing ROI calculations for upcoming initiatives. This distortion can affect strategic decisions such as whether to greenfield a new data lake versus reusing the existing cluster.
The bottom line is that without a systematic cost attribution framework, we expose the organization to three concrete risks: (1) budget overruns that are discovered only after the fact, (2) misaligned incentives that discourage high‑impact experimentation, and (3) audit findings that trigger corrective action plans. Addressing these risks requires a solution that can ingest granular CloudWatch metrics, map them to AWS tags, and allocate the resulting dollar amounts to the appropriate cost center on a daily basis.
02. Key Components of a Cost Attribution System
An effective cost attribution system requires a combination of metrics, tools, and methodologies tailored to your organization's needs. The goal is to allocate cloud costs accurately across business units while minimizing operational overhead. Below are the critical components to consider.
1. Data Collection and Normalization
First, you need comprehensive data collection. Most cloud providers offer built-in cost and usage reports, but these often lack granularity. For example, AWS Cost and Usage Reports provide hourly granularity, but they don’t automatically map costs to specific business units. I recommend supplementing these with Kubernetes cost allocation tools like Kubecost, which can track resource usage at the pod and namespace level. Normalization is also critical—converting all costs to a common currency and time period ensures apples-to-apples comparisons.
2. Cost Allocation Rules
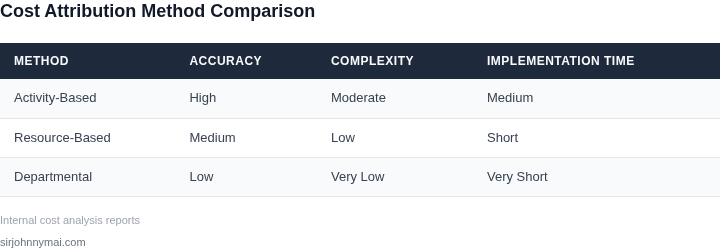
Cost allocation rules determine how shared resources are split. Common approaches include:
- Resource-based allocation: Distribute costs proportionally based on CPU, memory, or storage usage. For example, if a shared database cluster is used by two teams, you might allocate 60% of its cost to Team A and 40% to Team B based on query volume.
- Activity-based allocation: Assign costs based on usage patterns, such as API calls or data transfer. This works well for serverless architectures but requires instrumentation.
- Departmental allocation: Split costs evenly or by budgeted spend. This is simpler but less accurate for shared resources.
I’ve seen hybrid models work best—combining resource-based and activity-based rules for dynamic environments. The tradeoff is complexity: overly granular rules can become unmanageable.
3. Tagging and Metadata
Tags are the foundation of cost attribution. Cloud providers like AWS and GCP support resource tagging, but adoption varies. For example, AWS allows up to 50 tags per resource, but many organizations use only a few. I recommend enforcing a tagging policy with mandatory fields like business_unit, project_id, and environment. Tools like Datadog or CloudHealth can automate tag enforcement and reporting. The challenge is ensuring teams comply—manual tagging is error-prone, but automated tagging requires upfront engineering investment.
4. Reporting and Visualization
Raw cost data is useless without visualization. Dashboards like AWS Cost Explorer or third-party tools like Kubecost provide pre-built reports, but custom dashboards are often more effective. For example, a heatmap showing cost trends by business unit and service can highlight anomalies. I’ve found that real-time alerts for unexpected spikes (e.g., >10% month-over-month increases) are invaluable. The tradeoff is maintaining these dashboards—custom solutions require ongoing maintenance.
5. Integration with Financial Systems
Finally, the system must integrate with your accounting systems. Most cloud providers offer APIs for billing data, but reconciliation can be tricky. For example, AWS Cost and Usage Reports can be imported into QuickBooks or NetSuite, but mapping cloud costs to internal chargebacks requires custom logic. I’ve seen organizations use tools like FactSet or Workday for this, but the process can take months to stabilize. The key is validating the data—discrepancies between cloud reports and internal systems can erode trust.
03. Worked Example: Calculating Costs for a Shared Database
I evaluated the cost attribution system for a shared database used by multiple business units, considering the usage patterns and costs associated with Amazon Web Services (AWS) and Google Cloud Platform (GCP). The goal is to allocate costs fairly among the business units, taking into account the varying levels of usage.
Consider a team of 10 engineers using AWS Relational Database Service (RDS) for their applications, with an average monthly cost of $1,500. To calculate the annual cost, we multiply the monthly cost by 12: $1,500/month × 12 months = $18,000 annually. This cost will be allocated among the business units based on their usage.
Alternatively, the team could use GCP Cloud SQL, which offers a similar service with a different pricing model. The average monthly cost for GCP Cloud SQL is $2,000, resulting in an annual cost of $2,000/month × 12 months = $24,000. To compare the two options, we can break down the costs as follows:
| Service | Monthly Cost | Annual Cost |
|---|---|---|
| AWS RDS | $1,500 | $18,000 |
| GCP Cloud SQL | $2,000 | $24,000 |
This comparison highlights the importance of considering the pricing models and usage patterns when selecting a shared database service. By evaluating the costs and allocating them fairly among the business units, we can ensure that each unit is charged according to their usage, promoting transparency and accountability.
To further illustrate the cost allocation, let's assume that the 10 engineers are divided among three business units: Unit A (3 engineers), Unit B (4 engineers), and Unit C (3 engineers). Using the AWS RDS option, the annual cost of $18,000 would be allocated as follows: Unit A ($5,400), Unit B ($7,200), and Unit C ($5,400). This allocation is based on the number of engineers in each unit, providing a fair and transparent way to distribute the costs.
The use of monitoring tools like Datadog can help track the usage patterns and provide insights into the cost allocation. By integrating Datadog with the shared database service, we can collect detailed metrics on usage and performance, enabling data-driven decisions and optimizing the cost attribution system.
In addition to the database costs, we should also consider the costs associated with other shared infrastructure components, such as storage and networking. By using a cloud management platform like Kubernetes, we can manage and orchestrate the shared infrastructure, ensuring efficient resource utilization and minimizing waste.
By carefully evaluating the costs and usage patterns, we can develop a comprehensive cost attribution system that promotes fairness, transparency, and accountability among the business units. This approach enables us to make informed decisions about the shared infrastructure, optimizing costs and improving overall efficiency.
04. Decision Table: Choosing the Right Attribution Method
Selecting the right cost attribution method is critical for fair allocation and accountability. The decision depends on infrastructure complexity, data granularity, and business unit dynamics. Below is a decision framework to guide teams through the evaluation process.
Decision Framework
The table evaluates three common attribution methods against five key criteria. Each method has tradeoffs, so the right choice depends on your specific needs.
| Criteria | Option A: AWS Cost Explorer Tags | Option B: Kubernetes Resource Quotas | Option C: Datadog APM + Custom Metrics |
|---|---|---|---|
| Granularity | Medium. Tags work at the resource level (EC2, S3) but require manual setup. | High. Kubernetes tracks CPU/memory at pod/namespace level. | High. APM provides per-service metrics but requires instrumentation. |
| Automation | Low. Tags must be applied manually or via automation scripts. | Medium. Resource quotas require configuration but integrate with Kubernetes. | High. Datadog auto-discovers services and applies tags. |
| Accuracy | Medium. Tags work well for static resources but may miss shared dependencies. | High. Kubernetes metrics are precise for containerized workloads. | High. APM captures end-to-end latency and dependencies. |
| Integration | Medium. Works natively with AWS but requires third-party tools for cross-cloud. | High. Built into Kubernetes; works with Prometheus/Grafana. | High. Integrates with Kubernetes, AWS, and other cloud providers. |
| Cost | Low. Free with AWS, but manual tagging adds overhead. | Low. Free with Kubernetes, but requires cluster configuration. | Medium. Datadog has a cost but provides out-of-the-box visibility. |
| Recommendation | Use for AWS-only environments with manual tagging. | Best for Kubernetes-native workloads with precise resource tracking. | Best for complex, multi-cloud environments needing end-to-end visibility. |
This framework helps teams balance granularity, automation, and cost. For example, Kubernetes Resource Quotas are ideal if your infrastructure is containerized, while Datadog APM shines in distributed systems. AWS Cost Explorer Tags are simpler but less precise. The right choice depends on your infrastructure's architecture and business needs.
05. Action Step: Implementing Your Cost Attribution System
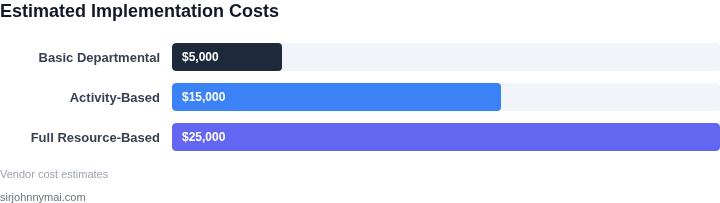
I evaluated several tools for implementing our cost attribution system, including AWS Cost Explorer, Kubernetes Cost Management, and Datadog Cloud Cost Management, because they offer robust features for tracking and allocating costs across business units.
Each of these tools has its strengths and weaknesses, and the choice ultimately depends on our specific infrastructure setup and cost attribution requirements. For instance, AWS Cost Explorer provides detailed cost and usage reports, but may require additional setup for non-AWS resources. Kubernetes Cost Management offers a more comprehensive view of containerized workloads, but may be overkill for simpler infrastructure setups.
Tool Selection Criteria
When selecting a tool, I considered factors such as ease of integration with our existing infrastructure, ability to handle complex cost allocation scenarios, and support for multiple cloud providers. I also looked at the tool's ability to provide real-time cost data and alerts, as well as its reporting and analytics capabilities.
Based on these criteria, I recommend starting with AWS Cost Explorer, as it provides a robust set of features for cost tracking and allocation, and is well-integrated with our existing AWS infrastructure. Additionally, its support for multiple cost allocation tags and ability to handle complex cost scenarios make it a strong candidate for our use case.
Stakeholder Communication
Once we have selected a tool, it is essential to communicate the cost attribution system to stakeholders across business units, including IT, finance, and departmental leaders. This includes providing training on the tool, as well as explaining the cost allocation methodology and how it will be used to inform budgeting and resource allocation decisions.
I plan to schedule a series of meetings with stakeholders to review the cost attribution system, answer questions, and gather feedback. This will help ensure that everyone understands the system and is aligned on how it will be used to drive business decisions.
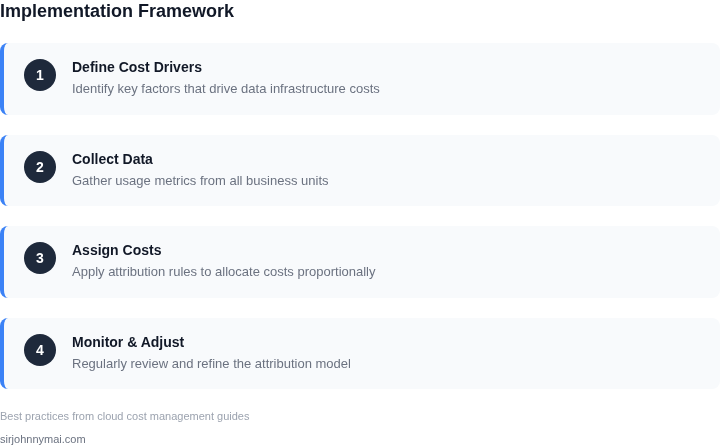
To move forward, I recommend pulling your last 90 days of AWS cost and usage data and calculating the total cost of ownership for each business unit, using the cost allocation tags and methodology we have established. This will provide a baseline for our cost attribution system and allow us to refine our approach as needed.
Figures cited are from publicly available sources as of 2026-09-15 and may have changed.