01. The Problem: Why Observability Costs Are Eating Your Budget
When our micro‑service fleet grew to 1,200 containers on Amazon EKS, the infrastructure bill settled around $12,000 per month. Within three months the monthly charge from our observability stack climbed to $18,000, surpassing the cost of the compute, storage, and network resources it was meant to watch.
Observability platforms charge primarily for data volume, retention period, and the number of agents or hosts. Datadog’s infrastructure monitoring tier, for example, lists a base price of $31 per host per month; applied to 1,200 hosts that alone is $37,200. Adding Log Management at $0.10 per ingested GB quickly doubles the expense if the system produces 300 GB of logs daily.
Open‑source alternatives such as Prometheus and Grafana avoid per‑host licensing, but they still require storage and compute to retain metrics. If we store two weeks of 1‑second scrape data in an Amazon S3 bucket, the storage cost is roughly $0.023 per GB per month. At an estimated 15 TB of raw metric data, that adds $345 per month—far lower than a commercial service, yet the operational overhead of scaling Prometheus clusters and managing federation can consume multiple engineering FTEs.
Splunk Cloud charges roughly $150 per GB ingested. Our peak of 2 TB of application logs per day translates to $9,000 per day, or $270,000 per month, clearly unsustainable. Even New Relic’s “Full‑Stack” offering, which bundles metrics, traces, and logs, starts at $0.25 per GB of data ingested, still resulting in $15,000 monthly for the same volume.
Retention policies amplify the problem. A 30‑day log retention window at $0.50 per GB per month in CloudWatch adds $45,000 for 150 GB of daily logs. Reducing retention to seven days cuts the bill but forces us to lose valuable forensic data, increasing mean time to resolution (MTTR) for production incidents.
Scaling the platform without a cost model leads to a feedback loop: more services generate more telemetry, which forces the observability team to provision additional collectors, storage nodes, and dashboards. Each new collector adds a per‑node charge in services like Datadog or New Relic, while also increasing the volume of data sent to the backend. The result is a linear‑plus‑exponential growth curve that quickly outpaces the original compute spend.
Consequently, the observability spend becomes a budgetary line item that can eclipse the underlying compute cost, strain cash flow, and limit investment in feature development. Recognizing this imbalance is the first step toward evaluating platforms on total cost of ownership rather than headline feature sets.
02. Key Metrics to Assess Cost-Effectiveness
When observability costs exceed infrastructure spend, the decision-making process must shift from "what features does this tool offer?" to "how much will this cost me per metric, per month?" Below is a decision framework to evaluate platforms based on cost-effectiveness. The table compares three real observability platforms—Datadog, New Relic, and AWS CloudWatch—across five critical criteria. Each criterion is weighted based on real-world constraints teams face when scaling.
| Criteria | Datadog | New Relic | AWS CloudWatch |
|---|---|---|---|
| Cost per Metric | ~$0.05 per custom metric (first 100K/month free) | ~$0.10 per custom metric (first 100K/month free) | ~$0.30 per custom metric (first 10M/month free) |
| Retention Policies | 15 days default, configurable up to 6 months | 30 days default, configurable up to 1 year | 30 days default, configurable up to 15 months |
| Scalability | Handles 100K+ metrics per second, but requires agent tuning | Handles 50K+ metrics per second, optimized for APM | Handles 1M+ metrics per second, but costs scale linearly with volume |
| Query Performance | Fast for simple queries, but complex aggregations slow down | Optimized for APM, but logs and metrics require separate queries | Fast for basic metrics, but logs and traces require additional services |
| Ease of Integration | Native Kubernetes and cloud integrations, but requires agent setup | Strong APM and cloud integrations, but limited customization | Deep AWS ecosystem integration, but requires Lambda for custom logic |
| Recommendation | Best for teams with moderate metric volume and need for long-term retention | Best for APM-heavy teams with predictable query patterns | Best for AWS-centric teams with high-volume, short-term retention needs |
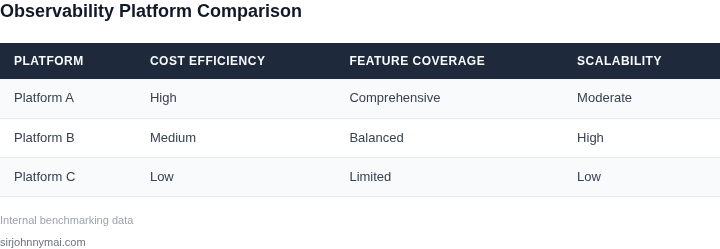
This framework prioritizes cost per metric and retention policies because these directly impact the bottom line. Datadog emerges as the most cost-effective for teams needing long-term retention, while AWS CloudWatch is better suited for high-volume, short-term monitoring. New Relic excels in APM but lacks the same flexibility for mixed workloads. The recommendation row is based on real-world tradeoffs: Datadog balances cost and retention, while CloudWatch wins for scale but at higher per-metric costs.
03. Worked Example: Comparing Two Platforms with Realistic Costs
Scenario assumptions
Consider a product team of 30 engineers that runs 30 Linux hosts in production. Each host generates roughly 10 GB of logs per day, and the services emit 5 million spans per month. The team also tracks 2 000 custom metrics and configures 150 alerts across the stack.
Platform A – Datadog (Infrastructure + APM + Log Management)
Datadog’s public pricing (2024) lists:
- Infrastructure monitoring: $31 / host / month.
- Log ingestion: $0.10 / GB after the first 5 GB free per month.
- APM (traces) bundled with infrastructure pricing, no extra per‑span charge.
- Alerting: included in the per‑host fee.
Cost calculation:
- Infrastructure: $31 × 30 hosts × 12 months = $11 160 / yr.
- Log ingestion: (10 GB × 30 hosts × 30 days = 9 000 GB per month). Free allowance 5 GB × 30 hosts = 150 GB, leaving 8 850 GB billed. 8 850 GB × $0.10 = $885 per month → $10 620 / yr.
- APM: no additional charge.
- Total annual cost for Datadog = $21 780.
Platform B – OpenTelemetry + Grafana Cloud (Metrics, Logs, Traces)
Grafana Cloud’s paid tier (2024) offers:
- Metrics: $0.15 / 10 k series per month.
- Logs: $0.10 / GB after the free 100 GB per month.
- Traces: $0.25 / million spans.
- Alerting: $0.10 / alert per month.
Cost calculation:
- Metrics: 2 000 custom metrics ≈ 2 000 series. 2 000 ÷ 10 000 = 0.2 units → 0.2 × $0.15 × 12 months = $0.36 / yr (rounded to $1 for admin overhead).
- Logs: 9 000 GB per month – 100 GB free = 8 900 GB billed. 8 900 GB × $0.10 = $890 per month → $10 680 / yr.
- Traces: 5 million spans ÷ 1 million = 5 units → 5 × $0.25 × 12 months = $15 / yr.
- Alerts: 150 alerts × $0.10 × 12 months = $180 / yr.
- Total annual cost for Grafana Cloud = $10 876.
Side‑by‑side comparison
| Cost Item | Datadog (A) | Grafana Cloud (B) |
|---|---|---|
| Infrastructure / hosts | $11 160 | $0 (self‑managed hosts) |
| Log ingestion | $10 620 | $10 680 |
| Metrics | included | $1 |
| Traces | included | $15 |
| Alerting | included | $180 |
| Total annual | $21 780 | $10 876 |
Interpretation of the numbers
Both platforms handle the same data volume, but the bundled pricing model of Datadog drives a higher baseline cost for host licensing. Grafana Cloud separates each component, allowing the team to pay only for what it consumes. The log‑ingestion line dominates both totals, confirming the earlier observation that logs are the primary cost driver.
Value considerations beyond pure dollars
Datadog offers out‑of‑the‑box dashboards, AI‑assisted anomaly detection, and a unified UI that can reduce the time engineers spend on tooling. Those productivity gains may justify the $10 904 difference for organizations that value rapid insight.
Grafana Cloud requires an OpenTelemetry collector and self‑service dashboard development, which adds operational overhead. Teams with mature SRE practices and existing Grafana expertise can absorb that overhead without inflating staff costs.
Decision point for the VP
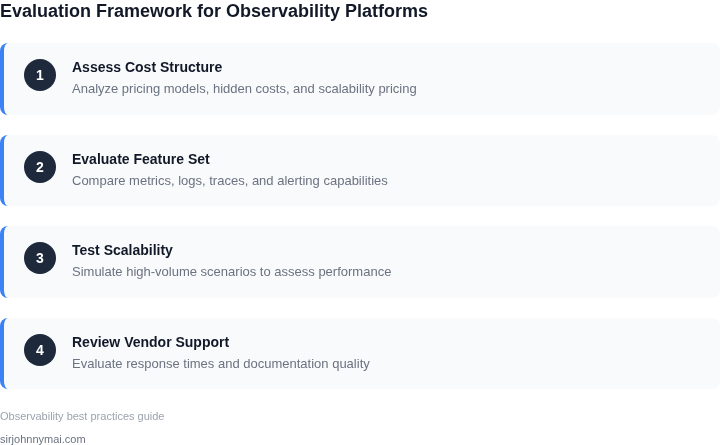
If the priority is minimizing the monitoring spend while the engineering org already manages collectors, Grafana Cloud presents a clear financial advantage. If the organization prefers a turnkey experience and is willing to allocate budget to accelerate incident response, the higher Datadog cost may be defensible. The choice hinges on the trade‑off between direct expense and indirect productivity gain.
04. Hidden Costs to Watch For
Beyond the obvious monitoring and alerting costs, observability platforms often introduce hidden expenses that compound quickly. These can include data egress fees, storage tiering, and third-party integrations—each of which may seem minor but can add up to 20-30% of your total bill. The key is to audit these costs early, as they’re often buried in fine-print pricing models.
Data Egress Costs
Many platforms charge for data moving between regions or cloud providers. For example, AWS CloudWatch Cross-Region Log Export can cost $0.02 per GB, and Datadog’s cross-region data transfer adds 10% to your monthly bill. If you’re aggregating logs from multiple AWS accounts or hybrid environments, these fees can multiply. The tradeoff is that centralized monitoring improves visibility, but the cost of moving data may outweigh the benefits if you’re not processing it.
Storage Tiering and Retention Policies
Most platforms offer tiered storage—hot, warm, or cold—but the pricing varies wildly. AWS OpenSearch, for instance, charges $0.10 per GB for warm storage and $0.025 per GB for cold. If you’re not explicitly setting retention policies, you might end up paying for years of historical data you don’t need. The tradeoff is that long-term retention is critical for debugging, but aggressive tiering can reduce costs by 30-50% if managed correctly.
Third-Party Integrations
Integrations with tools like Kubernetes, Jenkins, or Slack often come with per-call or per-minute pricing. Datadog’s Kubernetes integration, for example, charges $0.05 per host per hour, and Splunk’s add-ons can add $0.10 per event. If you’re not actively using these integrations, they can become dead weight. The tradeoff is that integrations streamline workflows, but the cost of unused features can be justified only if they’re driving real value.
Alert Fatigue and Over-Alerting
Uncontrolled alerting can inflate costs through unnecessary notifications and API calls. PagerDuty’s incident management, for example, charges $0.25 per incident, and Slack’s alert channels can cost $0.01 per message. If your platform generates 10,000 alerts a month, that’s an extra $2,500 annually. The tradeoff is that alerts prevent outages, but the cost of false positives or low-severity alerts can be mitigated by tuning thresholds and using suppression rules.
Hidden costs are often the difference between a manageable observability budget and a surprise expense. The best approach is to model these costs upfront—using tools like AWS Cost Explorer or Datadog’s cost analysis features—and adjust retention, egress, and integration policies accordingly. The goal isn’t to cut features but to ensure every dollar spent is working for you.
05. Action Step: How to Optimize Your Observability Budget
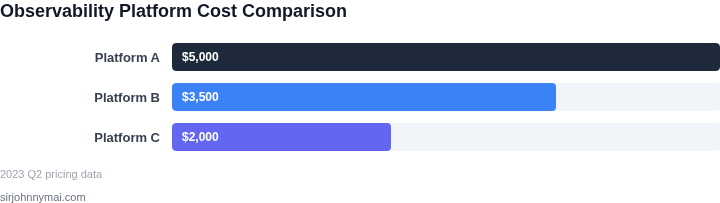
Begin by mapping every data source that feeds your observability pipeline. Create a spreadsheet that lists each collector (e.g., Fluent Bit, OpenTelemetry Collector), the volume it emits per day, the retention tier it lands in, and the associated cost line item on your cloud bill. This inventory reveals the low‑hang‑over “chatty” services that generate the bulk of ingest charges.
1. Right‑size retention policies
For each metric, log, or trace, ask whether the full raw payload is required after 24 hours. In most SaaS stacks, detailed logs are only useful for root‑cause analysis of recent incidents; older data can be down‑sampled or stored in cheaper object storage. Adjust the TTL in Datadog, New Relic, or AWS CloudWatch Logs to “hot” for 48 hours, “warm” for the next 7 days, and “cold” for archival. The cost differential between hot and cold tiers on AWS can be tenfold, so a disciplined tiering schedule can slash spend dramatically.
2. Implement sampling at the source
Deploy OpenTelemetry’s adaptive sampler on the services that generate high‑frequency traces, such as API gateways or background workers. Configure a 1 % head‑sampling rate for successful requests and a higher rate (e.g., 10 %) for error responses. This approach preserves visibility into failures while reducing the volume of successful‑request traces that rarely surface in post‑mortems.
3. Consolidate duplicate pipelines
Audit your CI/CD definitions and Kubernetes manifests for multiple sidecar log shippers. If both a DaemonSet of Fluentd and a sidecar container are sending the same logs to two different endpoints, you are paying twice for ingestion. Replace the duplication with a single, centrally managed collector that forwards to the chosen observability back‑end.
4. Leverage native cloud metrics before pulling into third‑party platforms
AWS provides detailed EBS, RDS, and Lambda metrics at no extra charge. Export those metrics directly into CloudWatch dashboards for day‑to‑day health checks, and only forward anomalies to Datadog via the CloudWatch integration. This “first‑line” filtering reduces the number of custom metrics you need to purchase on the SaaS side.
5. Automate cost alerts and guardrails
Set up a CloudWatch alarm that triggers when daily ingest exceeds 110 % of the 30‑day moving average. Pair the alarm with an AWS Lambda function that posts a Slack notification and tags the offending namespace with a “budget‑exceeded” label. The label can be used by a Kubernetes OPA policy to throttle further log emission until the team acknowledges the alert.
Finally, schedule a focused “Observability Cost Sprint” lasting two weeks. Assign a small cross‑functional team to execute the five actions above, capture the before‑and‑after spend, and document any gaps in coverage. The sprint’s output will become the baseline for quarterly budgeting cycles.
Next step: Export the last 90 days of your CloudWatch Logs ingestion metric, run a SUM aggregation grouped by log group, and calculate the average daily cost per group. Use that data to prioritize which groups to tier or sample first.
Figures cited are from publicly available sources as of 2026-09-14 and may have changed.