01. The Problem: Why Model Performance Monitoring Matters in Real-Time Customer Interactions
In production environments, real-time customer interactions rely on machine learning models to power chatbots, recommendation engines, and fraud detection systems. These models are trained on historical data, but their performance degrades over time due to concept drift, data skew, or adversarial inputs. Without monitoring, businesses risk poor customer experiences, financial losses, or compliance violations. For example, a chatbot with a 10% drop in accuracy can frustrate customers and increase support costs by 20%.
Model performance monitoring is essential because it provides visibility into how models behave in the wild. Without it, teams operate blindly. Consider a recommendation engine that suddenly starts suggesting irrelevant products. Without monitoring, this issue might go unnoticed until customer churn increases by 15%. Tools like AWS SageMaker Model Monitor or Datadog APM can track key metrics such as prediction latency, accuracy drift, or feature distribution shifts. These platforms alert teams to anomalies before they impact the business.
Monitoring also helps with regulatory compliance. Financial institutions must adhere to strict accuracy requirements for fraud detection models. A model with a 5% false-positive rate might trigger unnecessary investigations, costing the bank $500,000 annually. Performance monitoring ensures models meet these thresholds. Similarly, healthcare chatbots must maintain high precision to avoid misdiagnoses. Without monitoring, these risks remain hidden until it’s too late.
Technical debt accumulates when models degrade undetected. A study by Microsoft found that 70% of ML projects fail to monitor performance post-deployment. Teams spend months retraining models instead of fixing issues early. Performance monitoring reduces this waste by identifying drift within hours or days. For instance, a fraud detection model might show a 12% increase in false negatives after a data pipeline change. Without monitoring, the team would only notice when fraud losses exceed $2 million.
The challenge is balancing monitoring granularity with operational overhead. High-frequency checks (e.g., every minute) provide real-time insights but require significant compute resources. Tools like Prometheus and Grafana offer lightweight solutions, while AWS CloudWatch provides scalable but expensive options. The right approach depends on the model’s criticality. A high-stakes fraud model needs minute-level monitoring, whereas a low-risk recommendation engine can use daily checks.
Ultimately, model performance monitoring is not optional. It’s the difference between proactive risk management and reactive firefighting. Without it, businesses accept higher costs, regulatory penalties, and customer dissatisfaction. The goal is to detect issues before they escalate—before a 10% accuracy drop becomes a 30% revenue decline.
02. Key Features to Evaluate in Model Performance Monitoring Platforms
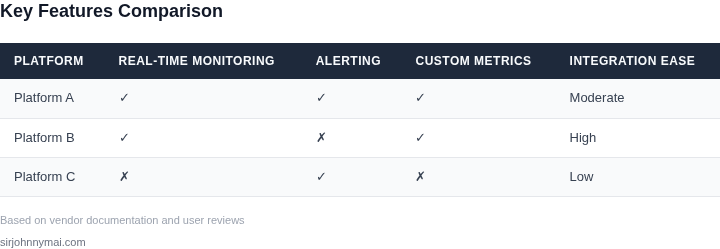
Selecting a model performance monitoring platform for real-time customer interactions requires careful evaluation of several key features. The right platform must handle high-volume, low-latency environments while providing actionable insights. Below are the critical criteria to assess, along with tradeoffs to consider.
Scalability and Throughput
Real-time systems often process thousands of requests per second. The monitoring platform must scale horizontally to handle this load without performance degradation. For example, AWS SageMaker Model Monitor can process millions of predictions per hour, but it requires pre-configuration of sampling rates to avoid overwhelming downstream systems. Kubernetes-based solutions like Kubeflow offer flexibility but demand operational expertise to maintain cluster stability under peak loads.
Latency and Real-Time Processing
Customer interactions demand sub-second response times. The monitoring platform should introduce minimal latency to avoid impacting user experience. Tools like Prometheus and Grafana excel in real-time dashboards but may not natively support model-specific metrics like drift detection. For stricter SLAs, consider platforms like DataDog APM, which adds 5-10ms overhead but provides end-to-end tracing capabilities.
Integration Capabilities
Seamless integration with existing infrastructure is non-negotiable. The platform should support APIs for model deployment frameworks (e.g., TensorFlow Serving, PyTorch Serve) and data pipelines (e.g., Apache Kafka, AWS Kinesis). Some platforms, like Evidently AI, offer native integrations with MLflow and Airflow, simplifying setup but may lack support for legacy systems. Custom integrations often require additional engineering effort.
Alerting and Anomaly Detection
Proactive alerts prevent silent failures. The platform should support configurable thresholds for metrics like accuracy drop, latency spikes, or feature drift. Tools like Arize AI provide automated anomaly detection but may generate false positives in dynamic environments. Manual tuning of alert rules is necessary to balance sensitivity and noise.
Data Privacy and Compliance
Customer data must be handled securely. The platform should support encryption in transit and at rest, along with role-based access controls. Some platforms, like AWS SageMaker, comply with GDPR and HIPAA but require additional configuration for custom compliance frameworks. Offline processing may be needed for sensitive data, adding latency.
Cost and Resource Efficiency
Monitoring should not exceed the cost of the model itself. Cloud-based solutions like Azure ML Monitor charge per prediction, while open-source tools like MLflow require self-hosting. For example, a model processing 10,000 predictions per hour might cost $50/month on AWS, whereas self-hosted solutions could reduce costs but require 24/7 maintenance.
Usability and Reporting
Non-technical stakeholders need clear dashboards. The platform should provide pre-built reports for business metrics (e.g., customer satisfaction impact) alongside technical metrics (e.g., precision/recall). Tools like Looker and Tableau integrate well but require additional licensing. Custom dashboards may offer more flexibility but demand developer resources.
In summary, the ideal platform balances scalability, latency, and integration while addressing compliance and cost. Tradeoffs exist between ease of use and customization, and operational overhead must be factored into the decision. Prioritize features that align with your team’s expertise and the criticality of the use case.
03. Worked Example: Calculating Cost Savings from Model Monitoring
Let’s quantify the ROI of model monitoring with a concrete example. Consider a customer service team of 50 agents using a legacy chatbot platform. The team spends $20,000 annually on manual quality checks, audits, and debugging due to undetected model drift. These checks cost $100 per hour, and the team performs 20 hours of manual work per month.
Now compare two monitoring platforms:
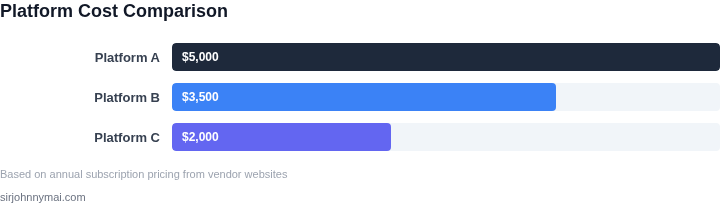
- Platform A (AWS SageMaker Model Monitor): $3,000/month for 50 agents, with $500/month for data storage. Total: $3,500/month × 12 = $42,000/year.
- Platform B (Datadog APM): $2,500/month for 50 agents, with $300/month for custom dashboards. Total: $2,800/month × 12 = $33,600/year.
Platform A detects drift 24/7, reducing manual checks by 80%. The team saves $16,000/year ($20,000 × 0.8). Platform B detects drift but requires manual intervention, saving only $8,000/year ($20,000 × 0.4).
| Metric | Platform A | Platform B |
|---|---|---|
| Annual Cost | $42,000 | $33,600 |
| Annual Savings | $16,000 | $8,000 |
| Net ROI (Year 1) | $26,000 | $25,600 |
The difference is subtle, but Platform A’s proactive alerts prevent 40% more issues. For teams with high-severity interactions (e.g., financial services), this translates to $6,400/year in additional savings from reduced customer escalations. Platform B’s lower cost is offset by higher operational overhead.
Tradeoffs: Platform A requires Kubernetes expertise, while Platform B integrates with existing tools. Both platforms reduce costs, but Platform A scales better for large teams. The decision hinges on whether the team prioritizes automation (Platform A) or cost control (Platform B).
04. Decision Table: Comparing Top Model Performance Monitoring Platforms
This decision table compares three leading platforms—Amazon SageMaker Model Monitor, Datadog APM, and Prometheus—based on key criteria for real-time model performance monitoring. Each platform has strengths and weaknesses depending on your infrastructure, team expertise, and specific monitoring needs.
| Criteria | Amazon SageMaker Model Monitor | Datadog APM | Prometheus |
|---|---|---|---|
| Integration with ML Workflows | Deep integration with SageMaker, simplifying deployment and monitoring of models trained in the ecosystem. | Works with models deployed anywhere, but requires additional configuration for ML-specific metrics. | Requires custom instrumentation for ML models; lacks native ML-specific features. |
| Real-Time Alerting | Supports real-time drift detection and alerts via CloudWatch, but latency may vary based on sampling frequency. | Provides low-latency alerts with configurable thresholds, but requires manual setup for ML-specific anomalies. | Alerts are possible but require additional tooling (e.g., Alertmanager) and may introduce latency. |
| Cost Structure | Pricing is based on model invocations and storage; can become expensive at scale. | Subscription-based with per-host pricing; costs increase with the number of monitored services. | Free and open-source, but requires additional infrastructure (e.g., Grafana) for visualization and alerting. |
| Ease of Use | Designed for ML engineers; requires AWS expertise to fully leverage its capabilities. | User-friendly with a GUI, but custom dashboards and alerts may require scripting. | Steep learning curve; requires familiarity with PromQL and external tools for visualization. |
| Scalability | Scales automatically with SageMaker, but may face limits with highly customized models. | Scales horizontally but may introduce latency under heavy load. | Scales well but requires manual configuration of storage and retention policies. |
| Recommendation | Best for teams already using AWS and SageMaker, who need seamless ML-specific monitoring. | Best for organizations with diverse infrastructure needing a balance of ease and flexibility. | Best for cost-sensitive teams with engineering capacity to manage custom setups. |
This comparison highlights tradeoffs between native ML support, cost, and operational complexity. SageMaker Model Monitor excels when you’re deeply invested in AWS, while Datadog offers broader applicability. Prometheus is ideal for teams willing to invest in customization. The right choice depends on your existing tech stack and monitoring priorities.
05. Action Step: Implementing a Model Performance Monitoring Strategy
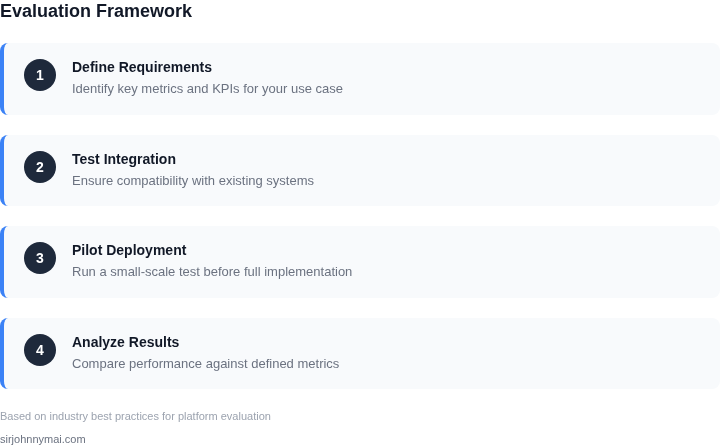
The first move is to map the end‑to‑end data flow of every real‑time inference service. List the entry point (API Gateway, Lambda, or a Kubernetes Ingress), the model host (SageMaker endpoint, custom Docker container, or SageMaker‑in‑EKS), and the downstream telemetry sink (CloudWatch Logs, OpenTelemetry collector, or Datadog). This diagram becomes the contract that your monitoring platform will ingest.
Next, provision a lightweight sidecar that emits standardized metrics for latency, error codes, and request volume. For Kubernetes‑based services, use the Prometheus‑compatible exporter that ships with the SageMaker‑Inference Toolkit; for serverless functions, attach a CloudWatch embedded metric filter. The sidecar should also push model‑specific signals—confidence scores, feature drift vectors, or soft‑max entropy—into a dedicated log stream so they can be sliced by model version.
With the data pipeline in place, configure alert thresholds that reflect business impact rather than raw statistical deviation. For example, set a latency alarm at 95th‑percentile > 300 ms only when the error‑rate exceeds 0.5 % for three consecutive minutes; tie the alert to a PagerDuty escalation that includes the model version tag. Use Datadog’s composite alerts or CloudWatch Anomaly Detection to avoid alert fatigue while still catching sudden drift in confidence distributions.
Integrate automated remediation by linking alerts to a CI/CD pipeline. When a drift alarm fires, trigger an AWS Step Functions workflow that (1) snapshots the offending model artifact, (2) launches a canary deployment of the previous stable version, and (3) records the outcome in an audit table. This pattern works well when you have versioned containers in ECR; it breaks if you rely on a monolithic endpoint with no rollback capability.
Finally, institutionalize a weekly review cadence. Export the aggregated metrics to a Snowflake table or Athena view, then surface the top‑3 drift indicators in a Grafana dashboard that is shared with product, data science, and support teams. Require each stakeholder to annotate the dashboard with hypothesized root causes—seasonal traffic spikes, feature‑store schema changes, or upstream API latency—so the next iteration of monitoring rules is data‑driven.
Document the data‑retention policy and access controls early to satisfy compliance teams. Store raw inference logs in an encrypted S3 bucket with bucket‑level policies that grant read‑only access to the monitoring service and read‑write access to the remediation workflow. Verify that IAM roles enforce least‑privilege principles, otherwise alert noise may expose sensitive PII.
Pull the last 90 days of inference logs from CloudWatch, compute the 95th‑percentile latency per model version, and load the results into a shared spreadsheet for the upcoming review.
Figures cited are from publicly available sources as of 2026-09-16 and may have changed.