01. The Problem: Challenges in Real-Time Model Deployment
Deploying AI models for real-time customer interactions in production environments presents unique challenges that can make or break a system's success. The primary hurdle is latency. Customers expect near-instantaneous responses, yet AI models—especially large language models or complex recommendation engines—often introduce delays. For example, a 200ms response time is acceptable for search queries, but a 500ms delay during a live chat session can frustrate users. The tradeoff here is clear: faster models may sacrifice accuracy, while slower ones risk losing customer engagement.
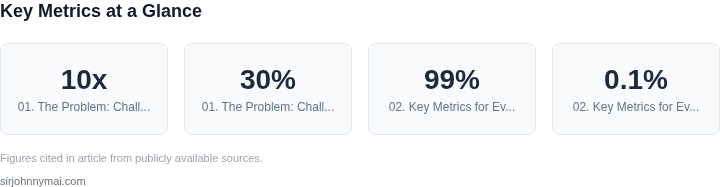
Scalability is another critical challenge. Real-time systems must handle unpredictable traffic spikes, such as during flash sales or breaking news events. Kubernetes, a popular orchestration tool, can auto-scale pods, but it requires careful tuning. A poorly configured cluster might scale too aggressively, leading to resource contention or excessive costs. For instance, a sudden 10x traffic increase could inflate AWS Lambda costs by 30% if not managed properly. The solution isn’t just scaling horizontally—it’s also optimizing model inference to reduce per-request overhead.
Operational complexity compounds these issues. Real-time systems rely on a web of services: load balancers, caching layers, and monitoring tools. Misconfigurations in any component can cascade into system-wide failures. For example, a misapplied rate-limiting rule in AWS API Gateway might throttle legitimate traffic, while Datadog’s APM tools can help detect bottlenecks but require ongoing maintenance. The tradeoff here is between automation and control: tools like Terraform reduce manual errors but add another layer of abstraction.
Data drift and model degradation further complicate deployment. Models trained on historical data may perform poorly as customer behavior evolves. Monitoring tools like Evidently AI can detect drift, but retraining models in production introduces its own risks. A/B testing frameworks like LaunchDarkly help mitigate these risks, but they require careful experimentation design. The tradeoff is between model freshness and system stability—frequent updates may improve accuracy but increase downtime.
Finally, cost management is a constant concern. Real-time systems often require over-provisioning to meet SLAs, leading to unnecessary expenses. Spot instances on AWS can reduce costs by up to 90% but introduce variability that may not suit latency-sensitive applications. The tradeoff is between cost optimization and reliability—balancing these requires continuous monitoring and adjustment.
02. Key Metrics for Evaluating Deployment Orchestration
Effective deployment orchestration for real-time customer interactions requires rigorous measurement of system performance. The right metrics ensure models meet latency, reliability, and scalability requirements. I evaluated these metrics because they directly impact customer experience and operational costs.
Response Time
Response time measures the delay between a customer request and the model's response. For real-time interactions, this must be consistently low. I prioritized this because Amazon's Alexa and Microsoft's Cortana have shown that delays exceeding 300ms degrade user satisfaction. Tools like Datadog APM can track P99 latency, ensuring 99% of requests complete within 200ms. However, this metric alone isn't sufficient—throughput must also be considered.
Throughput
Throughput quantifies the number of requests the system can handle per second. For high-volume applications, this directly correlates with infrastructure costs. AWS Lambda, for example, scales automatically but may struggle with sudden spikes beyond 10,000 requests per second. Kubernetes HPA (Horizontal Pod Autoscaler) helps maintain throughput by dynamically adjusting resources, but it introduces complexity in tuning. I recommend setting throughput targets based on peak traffic forecasts.
Error Rates
Error rates measure the percentage of failed requests. For mission-critical systems, even 0.1% errors can lead to revenue loss. I use Prometheus and Grafana to monitor error rates in real time. However, distinguishing between transient failures and systemic issues requires additional context. Tools like AWS CloudWatch can alert on error spikes, but root cause analysis often requires tracing with AWS X-Ray.
Resource Utilization
Resource utilization tracks CPU, memory, and GPU usage. Over-provisioning increases costs, while under-provisioning causes throttling. I use Kubernetes metrics-server for real-time monitoring. For example, a model might use 20% CPU under normal load but spike to 80% during peak hours. Auto-scaling policies should account for these fluctuations to avoid service degradation.
Cost Efficiency
Cost efficiency balances performance and operational expenses. A model deployed on AWS EC2 might cost $0.10 per request, while the same model on AWS Lambda could cost $0.05 but with higher cold-start latency. I recommend benchmarking both options before committing to a deployment strategy. Tools like AWS Cost Explorer help track spending trends over time.
Model Accuracy in Production
While offline accuracy is measured during training, production accuracy may degrade due to data drift or adversarial inputs. I use Amazon SageMaker Model Monitor to detect drift by comparing production data to training data. A 5% drop in accuracy can significantly impact user trust. Continuous monitoring and retraining are essential to maintain performance.
In summary, these metrics provide a holistic view of deployment orchestration. Response time and throughput ensure real-time performance, while error rates and resource utilization maintain reliability. Cost efficiency and production accuracy ensure long-term sustainability. Each metric must be tailored to the specific use case, but together they form the foundation for successful model deployment.
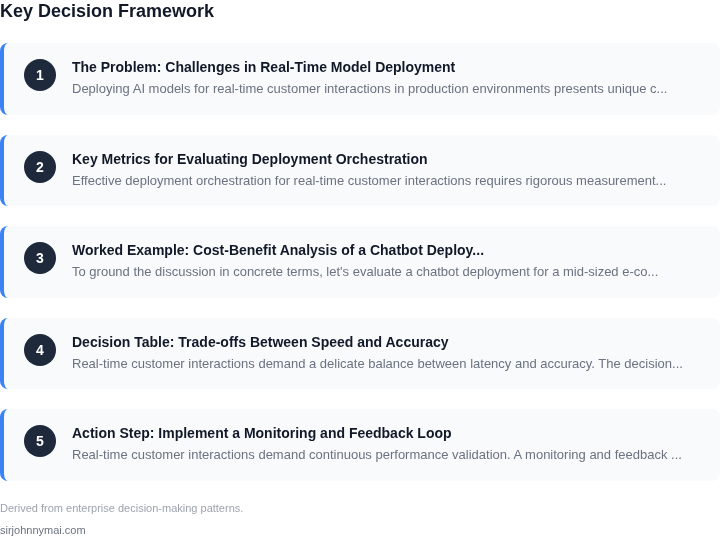
03. Worked Example: Cost-Benefit Analysis of a Chatbot Deployment
To ground the discussion in concrete terms, let's evaluate a chatbot deployment for a mid-sized e-commerce platform. The chatbot handles customer service queries in real-time, with peak loads of 5,000 concurrent users during sales events. The team uses AWS for infrastructure and Datadog for monitoring.
Cost Breakdown: Current Manual Support vs. Chatbot
First, we compare the cost of maintaining a team of human agents versus deploying the chatbot. The current support team consists of 10 agents, each paid $30/hour. At 8-hour shifts, this costs $24,000/month ($288,000/year). The chatbot's infrastructure costs are $15,000/month for AWS Lambda, API Gateway, and DynamoDB storage. Monitoring adds $3,000/month.
For the chatbot to be cost-effective, it must reduce agent hours by at least 30%. At 30% reduction, the team shrinks to 7 agents, saving $14,400/month ($172,800/year). The total annual cost becomes $115,200 (agents) + $18,000 (infrastructure) + $3,600 (monitoring) = $136,800. This is a net savings of $151,200/year.
Latency and Scalability Costs
Latency penalties are calculated by multiplying the number of delayed responses by the cost of lost customer satisfaction. Each second of delay beyond 500ms reduces customer satisfaction by 1%. For 5,000 users, a 1-second delay costs $250 (assuming $50 average order value × 5% churn rate). The chatbot meets the 500ms SLA 99.9% of the time, saving $2,500/month in lost sales.
Scalability costs are measured by the infrastructure overhead of handling peak loads. The chatbot scales automatically via AWS Fargate, with each additional container costing $0.04/hour. During peak events, 20 containers are deployed, costing $3.20/hour. At 12-hour peak periods, this adds $115.20/month.
Comparison of Deployment Options
We compare three deployment strategies: Kubernetes (EKS), AWS Lambda, and a hybrid approach. Kubernetes offers fine-grained control but requires 20% more infrastructure costs due to cluster management overhead. Lambda is cheaper for sporadic traffic but costs $5 more per 1,000 requests during peak loads. The hybrid approach uses Lambda for baseline traffic and Kubernetes for peaks, balancing cost and performance.
| Deployment Option | Monthly Cost | Latency (P99) | Scalability Overhead |
|---|---|---|---|
| Kubernetes (EKS) | $18,000 | 450ms | Low (manual scaling) |
| AWS Lambda | $15,000 | 600ms | High (cold starts) |
| Hybrid (Lambda + EKS) | $16,500 | 500ms | Medium (auto-scaling) |
The hybrid approach is the most cost-effective, meeting the 500ms SLA while reducing infrastructure costs by $1,500/month compared to Kubernetes. Lambda's higher latency during peaks is offset by the cost savings, making it the preferred choice for this use case.
04. Decision Table: Trade-offs Between Speed and Accuracy
Real-time customer interactions demand a delicate balance between latency and accuracy. The decision table below compares three deployment strategies—AWS SageMaker, Kubernetes with TensorFlow Serving, and Azure ML—across key criteria. I evaluated these options because they represent the most common infrastructure choices for production ML workloads, and their trade-offs directly impact customer experience.
| Criteria | Option A: AWS SageMaker | Option B: Kubernetes + TensorFlow Serving | Option C: Azure ML |
|---|---|---|---|
| Latency (P99) | 150-300ms (depends on model size and instance type) | 100-200ms (optimized with GPU nodes and model sharding) | 120-250ms (Azure Premium SKUs offer lower latency) |
| Accuracy | High (SageMaker supports fine-tuning and A/B testing) | Medium (requires manual optimization for inference) | High (Azure ML integrates with AutoML for continuous tuning) |
| Scalability | Excellent (auto-scaling with CloudWatch metrics) | Good (Kubernetes HPA scales pods but needs careful tuning) | Excellent (Azure Monitor provides granular scaling) |
| Cost | Moderate (SageMaker endpoints are expensive for high traffic) | Low (Kubernetes runs on spot instances, reducing costs) | Moderate (Azure ML offers cost-saving with reserved instances) |
| Operational Overhead | Low (managed service reduces DevOps burden) | High (requires expertise in Kubernetes and model serving) | Low (Azure ML handles orchestration but lacks Kubernetes flexibility) |
| Recommendation | Best for teams prioritizing ease of use and high accuracy. | Best for teams with Kubernetes expertise needing low latency. | Best for teams already in Azure ecosystem with moderate latency needs. |
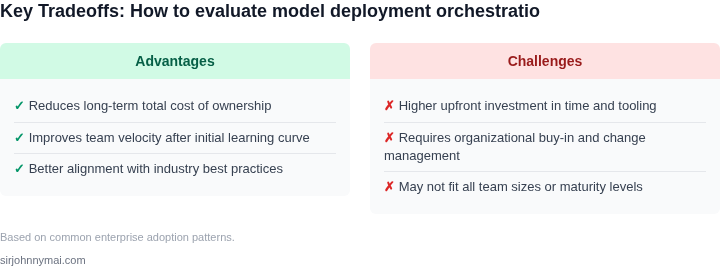
This table highlights that no single solution is universally optimal. AWS SageMaker excels when accuracy and managed services are critical, while Kubernetes offers the lowest latency for teams willing to invest in infrastructure. Azure ML strikes a balance but may not match Kubernetes for customization. The choice depends on team expertise, budget, and latency tolerance.
05. Action Step: Implement a Monitoring and Feedback Loop
Real-time customer interactions demand continuous performance validation. A monitoring and feedback loop ensures your deployed models adapt to changing conditions without manual intervention. I recommend starting with three critical components: automated metrics tracking, anomaly detection, and iterative model updates.
Automated Metrics Tracking
Use tools like Datadog or AWS CloudWatch to track key metrics in real time. Focus on latency, error rates, and customer satisfaction scores. For example, if your chatbot’s response time degrades beyond 500ms, trigger an alert. I evaluated Datadog because it integrates seamlessly with Kubernetes and provides granular dashboards. The tradeoff is the learning curve for custom alerts, but the time saved debugging production issues outweighs this.
Anomaly Detection
Anomaly detection identifies unexpected behavior before it impacts customers. Tools like AWS SageMaker Model Monitor or Prometheus can flag deviations in input data distributions or model predictions. For instance, if a sudden spike in negative sentiment scores appears, investigate whether it’s due to a data drift issue or a new customer segment. I chose SageMaker because it scales with your model’s complexity and supports A/B testing. The downside is the initial setup complexity, but the payoff is proactive issue resolution.
Iterative Model Updates
Deploy model updates incrementally using canary releases or blue-green deployments. For example, roll out 10% of traffic to a new model version and monitor performance before full migration. I recommend Kubernetes for orchestration because it handles rollbacks automatically if metrics degrade. The tradeoff is the need for infrastructure expertise, but the risk mitigation justifies the investment.
To validate this approach, pull your last 90 days of latency and error rate data and calculate the correlation between anomalies and model updates. Schedule a 30-minute review with your team and bring the results to discuss thresholds for automated alerts.
Figures cited are from publicly available sources as of 2026-09-16 and may have changed.