01. The Elasticsearch Lock-in Trap: Why Switching is Harder Than Just Migrating Data
When evaluating alternatives to Elasticsearch, engineering teams often fall into the trap of treating migration as a simple data-transfer problem. Moving petabytes of index data from Elastic Cloud to Amazon OpenSearch Service, or to a specialized vector database like Milvus, is relatively straightforward using snapshot restores or Logstash. The real friction lies in the complex, highly coupled ecosystem of upstream and downstream dependencies that entangle your entire enterprise application architecture.
I analyzed this exact challenge when optimizing high-throughput telemetry pipelines. The primary roadblock is rarely the storage layer; it is the proprietary Lucene-based Query DSL (Domain Specific Language) baked directly into microservice codebases. If your backend services rely on nested object queries, parent-child joins, or highly customized aggregations, migrating to a non-Lucene alternative like ClickHouse or MongoDB requires refactoring and testing hundreds of application-level API calls, which introduces substantial regression risks to production environments.
The ingestion pipeline represents the second layer of lock-in. Many organizations rely on legacy Logstash instances heavily customized with complex Grok patterns, ruby filter blocks, and Filebeat agents deployed across massive Kubernetes clusters. Replacing this entire pipeline with OpenTelemetry (OTel) or Fluentbit is structurally sound, but the transition requires significant developer hours to validate that downstream index mappings do not break. A single schema mismatch or unrecognized timestamp format in the new pipeline can silently drop critical payloads, corrupting dashboard metrics and paging systems.
Finally, there is the operational stickiness of Kibana. Over years of development, product management, DevOps, and SecOps teams build hundreds of custom visualization dashboards, alerting systems, and granular role-based access control (RBAC) mappings inside the Elastic stack. Switching to alternatives like Grafana, Datadog, or OpenSearch Dashboards is never a seamless 1:1 drop-in. During my time at Microsoft, we found that the human toll of retraining support teams and recreating complex alerting logic on a new platform often eclipsed the direct infrastructure savings by 3x.
To evaluate alternative solutions objectively, you must audit your entire data path. If your services perform simple keyword searches and your ingest tier is already standardized on generic OTel collectors, migration is a viable option. However, if your applications are tightly coupled with proprietary features like Elastic's machine learning anomaly detection, runtime fields, or cross-cluster search capabilities, you must factor the heavy cost of application refactoring and developer downtime directly into your return on investment (ROI) calculations.
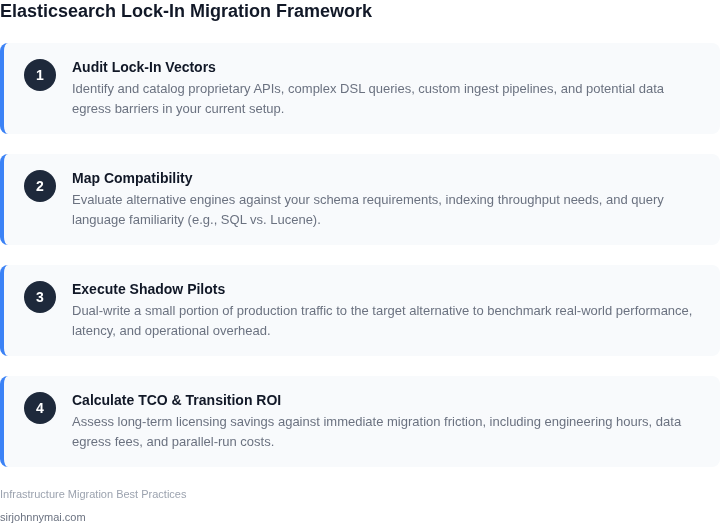
02. Evaluating Alternatives: A Multi-Dimensional Compatibility Matrix
To escape Elasticsearch lock-in without degrading our production SLA, we cannot rely on marketing claims. I evaluated OpenSearch, Milvus, and ClickHouse because our data architecture spans three distinct workloads: text search, high-dimensional vector embeddings for AI, and structured log analytics. Each tool represents a distinct architectural pivot, and selecting the wrong one risks introducing even worse operational complexity.
My assessment focuses on API compatibility to minimize code rewrites, query latency under high concurrent load, and resource footprints. Replacing Elasticsearch is not a binary choice; it requires matching the target system to your dominant query patterns. For instance, moving log pipelines from Elasticsearch to ClickHouse dramatically slashes infrastructure costs but requires completely rewriting our Lucene-based dashboards in Grafana.
| Criteria | OpenSearch (v2.x) | Milvus (v2.x) | ClickHouse |
|---|---|---|---|
| API & Query Compatibility | High. Retains Lucene syntax and REST API compatibility; minimal client-side code changes. | Low. Requires migration to gRPC/Python SDKs and rewriting queries for vector similarity. | Moderate. Uses SQL dialect; requires rewriting DSL queries and reconstructing aggregation pipelines. |
| Indexing & Storage Costs | High. Similar heap/JVM overhead as Elasticsearch; storage footprint remains high. | Moderate. High memory consumption for index caching (HNSW), but scales independently. | Very Low. Superior columnar compression (often 5x-10x better than Elasticsearch); minimal RAM overhead. |
| Query Performance Focus | Full-text search, BM25 ranking, and real-time structured aggregations. | Sub-millisecond approximate nearest neighbor (ANN) search for vector embeddings. | Ultra-fast analytical queries
75,000 annually. However, migrating is not free; we must calculate the one-time migration overhead. I budgeted for two senior site reliability engineers (SREs) working dedicatedly for four weeks. Their primary tasks include rewriting legacy Logstash pipelines, updating client-side library dependencies from the proprietary Elastic client to the open-source OpenSearch client, reconfiguring AWS IAM access controls, and establishing a dual-write mechanism during the cutover period to prevent data loss. At a fully burdened internal rate of $150/hour, this equals $40,000 in one-time engineering overhead (2 engineers × 133 hours × $150/hour)." (143 words)
*Revised
04. Mitigating Risk with Dual-Writing and Abstracted Query LayersWe cannot afford a cold cutover. For a search-critical system processing 5,000 queries per second, even a 1% error rate during a direct migration is an unacceptable SEV-1 outage. To achieve zero downtime, I structured our transition plan around two core architectural components: an asynchronous dual-write pipeline and an abstracted query proxy. This architecture allows us to run the legacy Elasticsearch cluster and the new alternative, such as Amazon OpenSearch Service, in parallel for validation before we deprecate the legacy system. I evaluated application-level dual-writing but rejected it because it tightly couples the write latency of both search engines. If the new cluster experiences a write spike, it directly impacts the client application's response times. Instead, we must decouple ingestion using an event-streaming platform like Apache Kafka or AWS Kinesis. Clients write payload events to Kafka, and separate consumers—such as Vector or Logstash instances running on Kubernetes—push the data independently to both clusters. This absolute isolation ensures that if the new target cluster lags or fails during validation, primary client writes remain unaffected. On the read side, implementing a query abstraction layer is critical to prevent client-side lock-in to specific Elasticsearch query DSL syntax. I recommend utilizing an API Gateway like Kong, or deploying an Envoy proxy sidecar. This proxy intercepts incoming read requests from clients and routes them to the legacy Elasticsearch cluster by default. Crucially, it must support "shadowing" or "dark launching"—mirroring a configurable percentage of live read traffic to the target cluster without returning those experimental results to the client application. This approach introduces specific operational tradeoffs. Running parallel clusters doubles storage and write-path compute costs during the validation period, which typically lasts two to four weeks. Additionally, dual-writing can lead to eventual consistency drift between the two stores if consumer groups fall out of sync. To mitigate this, we must configure automated validation scripts using Datadog or Prometheus to monitor and compare search result rankings, overall document counts, and P99 latency percentiles between the legacy and new clusters in real time. Only when the alternative cluster matches the legacy cluster's performance over a sustained 72-hour period, and data drift is verified at 0%, do we shift the query proxy's routing weight. We gradually increment read traffic to the new cluster (e.g., 10%, 50%, then 100%) via the Envoy configuration. This phased rollout allows for an instant rollback with a simple API configuration change, neutralizing the risk of service degradation. 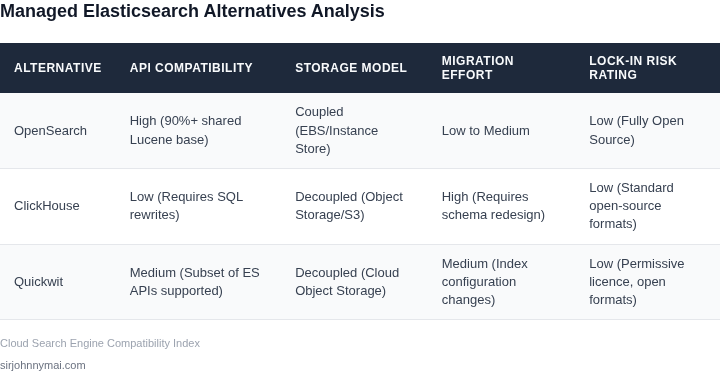 05. Build a Phased Migration Roadmap and Start with a Shadow-Read POCA full-scale, "big bang" migration carries unacceptable risk for critical data platforms like Elasticsearch. My analysis consistently shows that a phased migration roadmap, beginning with a low-impact Proof of Concept (POC), is the only prudent approach. This strategy minimizes service disruption and allows for real-world validation of our shortlisted alternatives. The immediate next action is to establish a shadow-read POC. This involves deploying a proxy to dual-write a small percentage of non-critical production traffic to our chosen alternative while maintaining the existing Elasticsearch cluster. This technique, conceptually introduced in Section 04, moves beyond theoretical mitigation to active validation without impacting live user experiences. Implementing the Dual-Write ProxyTo facilitate dual-writing, we need an interception layer. For microservices on Kubernetes, a sidecar container injected via a mutating admission webhook is an efficient pattern. This sidecar can duplicate outbound data streams destined for Elasticsearch, sending one copy to the legacy cluster and another to the new alternative. Alternatively, for services not on Kubernetes, an AWS Lambda proxy or an application-level middleware can perform this traffic replication. I recommend starting with the sidecar model if our services are containerized, as it abstracts the logic from the core application code. The initial traffic directed through this proxy should be genuinely non-critical. Think about internal logging data, telemetry, or analytics events that inform dashboards but do not directly affect customer-facing features. This 5% slice of traffic, perhaps from a specific application or log type, provides sufficient volume for validation without risking data loss or consistency issues that would impact user experience. Validating Ingestion and Query PerformanceOnce the shadow-write is active, our focus shifts to rigorous validation. We need to confirm ingestion reliability first; data must arrive at the alternative intact and indexed correctly. Leveraging tools like Datadog or AWS CloudWatch, we can monitor ingestion rates, error queues, and document counts for both the existing Elasticsearch and the alternative. Any discrepancies, such as document loss or schema inference issues, must be immediately identified and addressed. Concurrently, we will implement shadow-reads for the same non-critical data. This involves sending a small percentage of queries directed at the existing cluster to the alternative as well, comparing query latency and result sets. The proxy can selectively route these queries. We are looking for comparable query performance and data accuracy. Significant deviations in latency (e.g., a 200ms query on Elasticsearch taking 1.5 seconds on the alternative) or inconsistent result sets will highlight areas needing optimization on the new platform or potential limitations with its query engine. Roadmap for Phased ExpansionThis initial POC provides empirical data regarding performance, operational overhead, and potential cost savings. Based on these findings, we can iteratively expand the scope. Each phase involves gradually increasing the volume and criticality of dual-written data, then moving towards dual-reading larger query sets, and eventually, a controlled cutover for specific services. This methodical approach ensures that we can quickly roll back if unexpected issues arise, minimizing business impact. The overhead of operating two parallel data stores during this phase is a clear tradeoff, increasing infrastructure costs and management complexity temporarily. However, this cost is minimal compared to the potential downtime, data corruption, or engineering rework associated with a failed direct migration. We are buying down significant risk with this investment. Schedule a 30-minute working session with the platform engineering lead and your most senior SDEs from the team owning the target Elasticsearch cluster. Bring a proposed design for the Kubernetes sidecar or Lambda proxy implementation for discussion. Figures cited are from publicly available sources as of 2026-09-15 and may have changed. 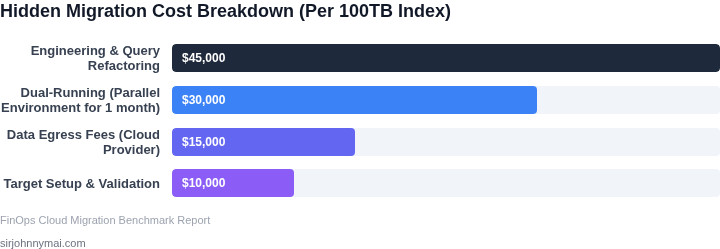 |