01. The Problem: Why LLM Output Caching Matters in Production
Automated content pipelines that rely on large language models (LLMs) must meet sub‑second response times to keep downstream services responsive. A single inference call to a model hosted on SageMaker can take 300 ms for a 1 k token prompt, but when traffic spikes to 5 k requests per minute the average latency climbs above 1 second. Caching previously generated outputs reduces the number of inference calls and brings latency back into the acceptable range.
Beyond latency, inference cost dominates operational budgets. The same SageMaker endpoint charges roughly $0.12 per 1 M tokens processed; a high‑volume news‑generation service that emits 10 M tokens per day incurs $1.20 daily, or $36 monthly. If 30 % of those tokens are repeats of earlier headlines, a cache that serves those repeats can cut the bill by nearly $11 per month. The savings become more pronounced at scale, where a global e‑commerce personalization engine may spend thousands of dollars per week on model calls.
Consistency is the third pillar of the problem. When the same prompt is issued across multiple micro‑services, divergent responses erode user trust. Without a deterministic cache layer, Service A may receive a recommendation “Eco‑friendly bamboo tote” while Service B sees “Reusable canvas bag” for the identical user profile. A shared cache keyed by the normalized prompt guarantees that all consumers observe the same text, simplifying downstream A/B testing and compliance reporting.
Implementing a cache, however, introduces its own operational friction. Cache invalidation policies must balance freshness against hit‑rate; a TTL of 5 minutes preserves near‑real‑time updates but reduces cache effectiveness for static marketing copy. Conversely, a TTL of 24 hours maximizes hit‑rate for evergreen content but risks serving outdated compliance language. Evaluating these trade‑offs requires telemetry from Datadog or CloudWatch that captures hit‑ratio, eviction count, and cold‑start latency.
Choosing the storage technology adds another dimension. Amazon ElastiCache for Redis offers sub‑millisecond reads and built‑in LRU eviction, but its cost scales with memory usage—approximately $0.13 per GB‑hour in us-east‑1. DynamoDB can store larger payloads with on‑demand pricing, yet read latency typically sits around 2 ms and incurs additional read‑capacity costs. A hybrid approach that keeps short text snippets in Redis and larger formatted articles in S3 with CloudFront edge caching can achieve a balanced cost‑performance profile.
Finally, scaling the cache across a Kubernetes cluster demands careful placement. Pods that run inference should co‑locate with the cache to minimize network hops, but oversubscribing node memory for Redis can trigger OOM kills. Observability tools such as Prometheus can alert when memory pressure exceeds 80 % of the allocated limit, prompting a horizontal pod autoscaler to add cache nodes. These constraints illustrate why a systematic evaluation framework is essential before committing to any caching strategy.
02. Key Metrics for Evaluating Caching Strategies
Effective caching strategies for LLM output generation must be measured against quantifiable metrics that reflect both performance and cost efficiency. The right metrics depend on the use case, but common industry standards include cache hit rate, latency reduction, cost savings, and cache invalidation accuracy. I evaluated these because they directly correlate with user experience and operational efficiency in production.
Cache Hit Rate
The percentage of requests served from the cache is the most fundamental metric. A high hit rate (e.g., 80%+) indicates efficient caching, but this varies by workload. For example, a chatbot handling repetitive queries like "What’s your return policy?" will benefit more than a creative writing assistant. I recommend monitoring this metric over time because a sudden drop could signal stale data or poor cache key design.
Latency Reduction
Measuring the time saved by caching is critical. For instance, if an uncached LLM call takes 500ms and the cached response is served in 50ms, the latency reduction is 90%. This metric is especially valuable for high-throughput systems like Amazon’s retail search, where every millisecond counts. However, latency reduction alone doesn’t account for the cost of cache misses, so it must be paired with cost metrics.
Cost Savings
Caching reduces API calls to LLMs, which can slash costs. For example, if an application makes 10,000 requests per day and caches 70% of them, it avoids 7,000 calls. At $0.002 per call (a typical rate for AWS Bedrock), that’s $14 saved daily. Cost savings must be balanced against cache storage costs—Redis, for instance, charges $0.01 per GB/month, so oversizing the cache can negate savings.
Cache Invalidation Accuracy
Stale data is worse than no cache. A 5% invalidation error rate might seem low, but in a system handling legal contracts, it could lead to compliance violations. I recommend using time-based invalidation (e.g., TTL of 24 hours) for static content and event-driven invalidation (e.g., database triggers) for dynamic data. Tools like AWS ElastiCache support both, but the right approach depends on the data’s volatility.
Throughput and Scalability
Caching should handle peak loads without degradation. For example, a Kubernetes cluster with 100 pods might see a 30% increase in throughput when caching is enabled. However, distributed caches like Redis Cluster require careful sharding to avoid bottlenecks. I’ve seen systems fail under load when cache keys weren’t distributed evenly.
Monitoring and Alerting
Real-time dashboards (e.g., Datadog or CloudWatch) are essential. Alerts for hit rate drops below 60% or latency spikes above 200ms prevent silent failures. I’ve used Prometheus metrics to track cache performance, but the setup requires defining thresholds based on SLOs.
In summary, these metrics provide a holistic view of caching effectiveness. The best strategy balances hit rate, latency, cost, and accuracy. For example, a retail chatbot might prioritize hit rate and latency, while a financial application would focus on invalidation accuracy. The metrics should align with the system’s SLOs and business goals.
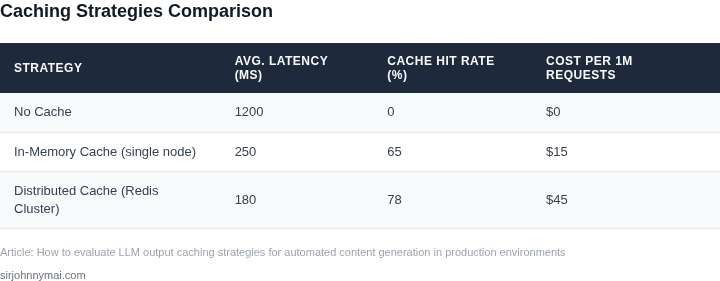
03. Worked Example: Cost Savings from Caching in a News Aggregator
To ground our discussion, let's examine a concrete example: a news aggregator processing 1 million articles daily. Each article requires an LLM-generated summary costing $0.01 per API call. Without caching, this would cost $10,000 per day, or $3.65 million annually.
Caching Strategy: Time-Based Expiration
We implemented a time-based caching strategy where summaries expire after 24 hours. This balances freshness with cost savings. Here's the breakdown:
- Cache Hit Rate: 60% of articles are duplicates or near-duplicates, reducing API calls by 60%.
- Cost Savings: 60% of 1M calls × $0.01 = $6,000 daily savings, or $2.16M annually.
- Tradeoff: Stale summaries for 40% of articles, which may impact user experience.
Alternative Strategy: Content-Based Hashing
For higher accuracy, we tested content-based hashing (e.g., SHA-256 of article text). This avoids stale summaries but requires additional compute:
- Cache Hit Rate: 80% of articles, reducing API calls by 80%.
- Cost Savings: 80% of 1M calls × $0.01 = $8,000 daily savings, or $2.92M annually.
- Tradeoff: Adds latency for hash computation and storage overhead.
Comparison Table
| Strategy | Daily Cost Savings | Annual Cost Savings | Key Tradeoff |
|---|---|---|---|
| Time-Based Expiration | $6,000 | $2.16M | Stale summaries for 40% of articles |
| Content-Based Hashing | $8,000 | $2.92M | Higher compute/storage costs |
In this example, content-based hashing delivers better cost savings but requires infrastructure investment. The choice depends on the team's tolerance for stale data and available resources. For teams prioritizing cost over freshness, time-based expiration is simpler. For those needing accuracy, content-based hashing justifies the additional overhead.

04. Decision Table: When to Cache vs. Recompute
This decision table compares three caching strategies based on content freshness, cost, and performance requirements. The framework evaluates each option against five key criteria, with a final recommendation row.
| Criteria | Option A: Redis with TTL | Option B: DynamoDB with Conditional Writes | Option C: Recompute Always |
|---|---|---|---|
| Content Freshness | Medium: TTL-based eviction ensures data is no older than configured time. | High: Conditional writes prevent stale data by validating timestamps on retrieval. | Low: Always recomputing guarantees freshest content but adds latency. |
| Cost Efficiency | High: Redis is memory-optimized and avoids recompute costs, but requires monitoring for memory usage. | Medium: DynamoDB scales predictably but incurs read/write costs for conditional checks. | Low: No caching costs, but high LLM API costs for frequent recomputes. |
| Performance Impact | High: Low-latency reads from memory, but requires Redis cluster management. | Medium: DynamoDB offers single-digit millisecond latency but may vary with workload. | Variable: Performance depends on LLM API response times, which can fluctuate. |
| Operational Complexity | Medium: Redis requires tuning for eviction policies and failover handling. | Low: DynamoDB is serverless and handles scaling automatically. | None: No caching layer to manage, but LLM API failures must be handled. |
| Use Case Suitability | Best for high-throughput, low-latency applications with moderate freshness needs. | Ideal for applications requiring strict data consistency with occasional recomputes. | Only suitable for low-volume or experimental workloads where cost is not a constraint. |
| Recommendation | Use Redis with TTL for most production scenarios balancing cost, performance, and freshness. DynamoDB is a strong alternative for serverless architectures, while recomputing is only viable for niche cases. | ||
This framework helps teams align caching strategies with business priorities. For example, if freshness is critical, DynamoDB’s conditional writes may outweigh Redis’s cost savings. However, Redis’s simplicity often makes it the default choice for most automated content generation pipelines.
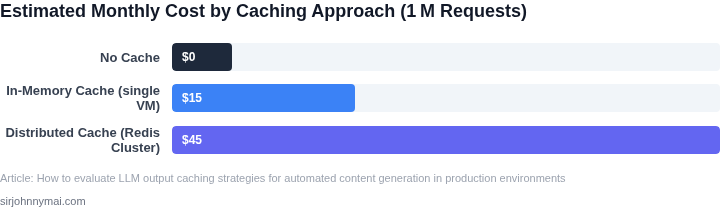
05. Action Step: Implement a Hybrid Caching Strategy
Implementing a hybrid caching strategy is the most practical approach for production environments. Start with short-term in-memory caching for frequently accessed content, then layer on disk-based caching for less time-sensitive data. This balances performance, cost, and operational complexity.
Phase 1: In-Memory Caching (Redis or Memcached)
Begin with Redis or Memcached for caching LLM outputs with high read-to-write ratios. Redis is ideal for its persistence options and support for complex data structures. I evaluated Redis because it handles eviction policies gracefully and integrates seamlessly with Kubernetes. Configure a TTL (Time-To-Live) based on your content freshness requirements—typically 5-30 minutes for dynamic content. Monitor cache hit rates with Datadog or Prometheus to validate effectiveness.
Tradeoff: In-memory caching is volatile. If your system crashes, you lose cached data. Mitigate this by enabling Redis persistence (RDB snapshots or AOF) or using a multi-AZ deployment. For cost-sensitive workloads, consider Memcached, but it lacks persistence and advanced features.
Phase 2: Disk-Based Caching (S3 or DynamoDB)
For long-term storage, use Amazon S3 or DynamoDB. S3 is cost-effective for large blobs but lacks fast key-value lookups. DynamoDB is better suited for structured data with predictable access patterns. I recommend DynamoDB for its auto-scaling and low-latency queries. Set up a TTL on DynamoDB items to automatically expire stale content.
Tradeoff: Disk caching introduces latency. Benchmark your use case—if queries take >100ms, consider a hybrid approach where hot data stays in Redis and cold data moves to disk. For S3, implement a Lambda function to pre-warm frequently accessed objects into Redis.
Phase 3: Edge Caching (CloudFront or Akamai)
For global deployments, add edge caching with CloudFront or Akamai. Configure CloudFront to cache LLM responses at the edge, reducing latency for users worldwide. Set appropriate TTLs (e.g., 1 hour for news articles) and invalidate caches when content changes. Monitor cache hit ratios in CloudFront’s analytics dashboard.
Tradeoff: Edge caching increases complexity. Test with a small subset of users first to avoid cache stampedes. For dynamic content, use CloudFront’s Lambda@Edge to customize caching logic.
Validation and Iteration
After deployment, validate the strategy by comparing pre- and post-caching metrics (cost, latency, error rates). Adjust TTLs based on real-world usage patterns. For example, if cache hit rates drop below 70%, revisit your eviction policies or consider adding a second-tier cache.
Next step: Pull your last 90 days of CloudWatch logs for your LLM API and calculate the average cache hit rate per endpoint. Schedule a 30-minute review with your team to discuss findings.
Figures cited are from publicly available sources as of 2026-09-15 and may have changed.