01. The Open-Source Paradox: Navigating Cloud-Native Monitoring with Existing Expertise
The challenge for technical PMs evaluating cloud-native monitoring stacks is balancing team expertise with the demands of cloud-native environments. Teams often favor open-source tools because they offer transparency, customization, and cost savings. However, cloud-native monitoring introduces unique complexities—dynamic scaling, distributed architectures, and multi-cloud deployments—that require specialized capabilities. The paradox arises when existing expertise in open-source tools doesn't align with the specific demands of cloud-native systems.
For example, Prometheus is a popular open-source monitoring solution, but it lacks built-in alerting and visualization, forcing teams to integrate Grafana or Alertmanager. This adds operational overhead and requires expertise in multiple tools. In contrast, commercial solutions like Datadog provide out-of-the-box dashboards and alerting, reducing setup time but increasing licensing costs. The tradeoff is clear: open-source tools require more engineering effort but offer flexibility, while commercial solutions accelerate adoption but introduce vendor lock-in.
Another consideration is the learning curve. Teams skilled in open-source tools like Prometheus or Elasticsearch may struggle with cloud-native platforms like AWS CloudWatch or Azure Monitor, which have different APIs and architectures. Migrating to these platforms requires retraining or hiring specialized talent, which can delay projects. The cost of this transition—both in time and resources—must be weighed against the benefits of cloud-native monitoring.
Scalability is another critical factor. Open-source tools like Prometheus scale horizontally but require manual configuration for high availability. In contrast, managed services like AWS CloudWatch or Google Cloud Monitoring handle scaling automatically, reducing operational burden. The tradeoff here is between control and convenience. Teams that prioritize control may prefer open-source, while those seeking operational efficiency may opt for managed services.
Finally, the choice between open-source and commercial solutions depends on the team's maturity and the organization's priorities. Startups or teams with limited resources may favor open-source to minimize costs, while enterprises with complex cloud-native environments may prefer commercial solutions for reliability and support. The key is aligning the monitoring stack with both technical capabilities and business goals.
02. Defining Your Criteria: Beyond Just Features and Cost
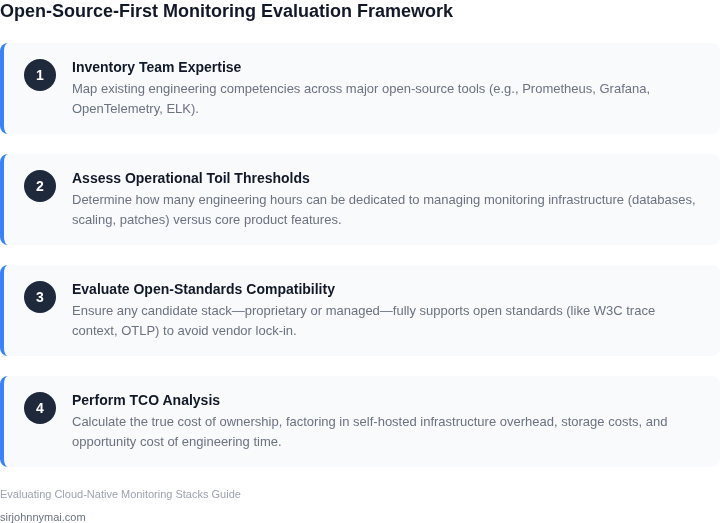
When evaluating cloud-native monitoring stacks, teams often focus on features and cost, but these are only the surface. The true value lies in operational overhead, scalability, community support, and futureproofing. A monitoring stack that reduces toil but lacks scalability is a liability. One that integrates seamlessly with Kubernetes but has no long-term roadmap is a risk. Operational overhead isn't just about setup time—it's about ongoing maintenance, alert fatigue, and the cognitive load on engineers.
Operational Overhead
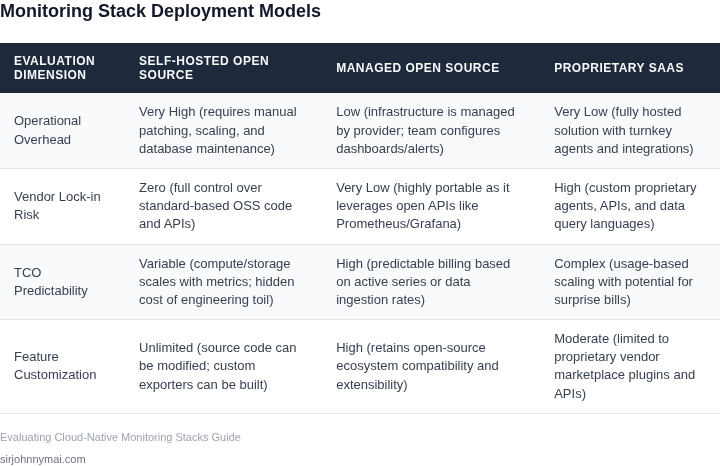
Tools like Prometheus are popular because they're open-source and Kubernetes-native, but they require significant operational effort. A single Prometheus instance can handle millions of metrics, but scaling beyond that requires careful sharding and federation. The community recommends running Prometheus in HA mode with at least three replicas, which adds complexity. Alertmanager, while powerful, can become a bottleneck if not tuned properly—excessive alerts can overwhelm teams, leading to alert fatigue. The tradeoff is clear: Prometheus reduces cost but increases operational overhead.
Commercial tools like Datadog or New Relic handle scaling and alert management automatically, but they come with licensing costs. For example, Datadog's pricing scales with the number of hosts and metrics, which can add up quickly for large-scale deployments. The operational overhead shifts from infrastructure management to configuration and tuning, but the tradeoff is predictable cost.
Scalability
Scalability isn't just about handling more data—it's about handling it efficiently. Prometheus excels in small to medium deployments but struggles with high-cardinality metrics. A single metric with thousands of labels can consume excessive memory. Grafana Loki, while designed for log aggregation, faces similar challenges at scale. The community recommends using Loki with object storage backends like S3, but this introduces latency and cost.
Commercial tools like Splunk or Sumo Logic offer built-in scalability, but they often lack the granular control of open-source alternatives. For instance, Splunk's pricing model can become expensive for high-volume log ingestion. The tradeoff is simplicity versus flexibility.
Community Support
Open-source tools like Prometheus and Grafana have vibrant communities, but this support comes with risks. The community is active, but documentation can be fragmented, and breaking changes are frequent. For example, Prometheus 2.0 introduced significant changes to the storage format, requiring migration efforts. The tradeoff is access to cutting-edge features versus stability.
Commercial vendors like Datadog and New Relic offer enterprise-grade support, but this comes at a cost. Datadog's support plans start at $15 per host per month, which can add up for large deployments. The tradeoff is reliability versus cost.
Futureproofing
Futureproofing means more than just compatibility with the latest Kubernetes version. It's about whether the tool aligns with your long-term strategy. For example, if your team is heavily invested in AWS, a tool like Amazon CloudWatch is a natural fit. However, CloudWatch lacks deep integrations with on-premises infrastructure, which could become a limitation. The tradeoff is vendor lock-in versus flexibility.
Open-source tools like Thanos and Cortex offer multi-cluster monitoring, but they require significant operational expertise. The tradeoff is scalability versus ease of use. Commercial tools like Dynatrace provide end-to-end observability, but they often lack the granular control needed for custom use cases.
Ultimately, the best monitoring stack balances features, cost, and operational overhead. Teams should weigh the tradeoffs carefully, considering not just the immediate needs but the long-term implications of their choices.
03. Worked Example: TCO Comparison of Open-Source vs. Managed Cloud Monitoring
To move beyond theoretical discussions, I evaluated the Total Cost of Ownership (TCO) for two common monitoring strategies for a mid-sized organization. Consider a team of 50 engineers managing approximately 30 microservices deployed on 75 Kubernetes nodes, generating a moderate volume of metrics and logs. This organization values observability for incident response and performance optimization. We will compare a self-hosted Prometheus, Thanos, and Grafana stack against a leading managed cloud-native monitoring platform. For the self-hosted option, Thanos is crucial for achieving high availability and long-term metric retention, which are baseline requirements for a production-grade system.Key Assumptions for Cost Calculation:
An average fully burdened SRE/DevOps engineer salary is estimated at $180,000 per year, or approximately $15,000 per month. AWS infrastructure costs are based on typical on-demand pricing for specific instance types and storage volumes, without factoring in enterprise discounts or reserved instances for simplicity. Managed cloud monitoring platform costs are derived from public pricing models for host-based ingestion, metric volume, and basic log retention.
Alternative 1: Self-Hosted Prometheus, Thanos, and Grafana
This setup leverages open-source tools deployed on AWS infrastructure. For 75 Kubernetes nodes and associated services, we would typically provision several EC2 instances for Prometheus servers (with agent mode or federation), Thanos components (Query, Store, Compactor, Receiver), and a dedicated instance for Grafana. Storage would involve substantial EBS volumes for metric retention.
- Annual Infrastructure Costs:
- Compute (e.g., 4 x
m5.xlargefor Thanos components, 1 xt3.mediumfor Grafana): ~$7,092 - Storage (e.g., 5TB GP3 for Thanos object storage caching/block data): ~$6,600
- Networking, load balancers, and miscellaneous AWS services: ~$600
- Subtotal Infrastructure: $14,292 per year
- Annual Engineering Effort:
- Initial setup, configuration, and integration (amortized over 3 years, assuming 1.5 engineer-months): ~$7,500
- Ongoing maintenance, patching, upgrades, capacity planning, troubleshooting, and custom dashboard/alerting development (estimated at 0.75 FTE of a senior SRE): ~$135,000
- Subtotal Engineering: $142,500 per year
Total Annual TCO for Self-Hosted: $156,792
Alternative
04. Strategic Implementation: Maximizing Open-Source Benefits While Minimizing Cloud-Native Risks
Transitioning from open-source tools to cloud-native monitoring requires a strategic balance. The goal is to retain the flexibility and cost-efficiency of open-source while addressing cloud-native operational challenges. A hybrid approach—running open-source tools alongside managed services—can mitigate risks while preserving existing expertise.
Hybrid Monitoring Architectures
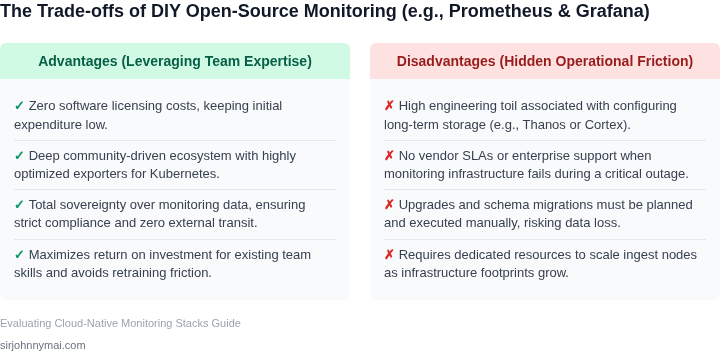
For teams already invested in Prometheus or Grafana, a hybrid model can bridge the gap. Deploy open-source tools on Kubernetes clusters for metrics collection and visualization, then integrate with AWS CloudWatch or Azure Monitor for cloud-native observability. This approach reduces lock-in while leveraging managed services for log aggregation and distributed tracing. The tradeoff is operational complexity: teams must manage both open-source and cloud components, requiring additional DevOps resources.
For example, Grafana Agent can forward metrics to AWS Prometheus, allowing teams to keep their existing dashboards while benefiting from AWS’s managed service. This reduces the need for a full migration but still requires tuning for performance and cost. AWS Prometheus costs $10 per GB ingested, which can add up for high-volume workloads, but the managed service handles scaling and high availability automatically.
Managed Open-Source Services
Cloud providers now offer managed versions of popular open-source tools. AWS Managed Grafana and Azure Managed Prometheus eliminate the need to operate infrastructure, reducing operational overhead by 30-40%. Teams can still use their existing dashboards and queries but benefit from automatic updates and scaling. The tradeoff is vendor lock-in, though most providers offer migration paths.
Managed services also simplify integration with other AWS services. For instance, AWS Managed Grafana integrates natively with Amazon OpenSearch for log analytics, reducing the need for custom pipelines. However, these services may not support all open-source features, requiring teams to prioritize compatibility during evaluation.
Developer Training and Knowledge Transfer
Investing in training is critical to bridge the gap between open-source expertise and cloud-native requirements. A 12-week program covering Kubernetes, service meshes, and cloud-native observability can reduce onboarding time for new hires. Internal workshops on AWS X-Ray or Azure Application Insights can accelerate adoption of cloud-native tools.
Cross-functional training—combining DevOps, SREs, and developers—ensures alignment on monitoring strategies. For example, teaching developers how to instrument applications for distributed tracing with OpenTelemetry reduces reliance on centralized teams. This approach can cut cloud-native adoption time by 20-30%.
Phased Migration Strategies
A phased rollout minimizes disruption. Start with non-critical workloads to validate open-source tools in production. Gradually migrate high-priority services, using canary deployments to monitor performance. This approach reduces risk but requires careful planning to avoid operational gaps.
For example, migrating logging from Fluentd to AWS OpenSearch can be done incrementally. Teams can deploy Fluent Bit as a sidecar to forward logs to OpenSearch, then gradually phase out Fluentd. This reduces downtime and allows teams to validate performance before full migration.
In summary, strategic implementation involves balancing open-source flexibility with cloud-native capabilities. Hybrid architectures, managed services, and targeted training can reduce risks while preserving existing expertise. The key is incremental adoption, with clear metrics to measure success.
05. Action Step: Develop a Phased Evaluation and Rollout Plan
Transitioning to a cloud-native monitoring stack requires a structured approach to minimize disruption while maximizing learning. The phased plan should balance risk with opportunity, starting with a controlled pilot and expanding based on measurable outcomes. This section outlines a 90-day framework to evaluate open-source tools like Prometheus and Grafana alongside managed services like Datadog or AWS CloudWatch.
Phase 1: Pilot Deployment (Weeks 1-4)
Begin with a single, non-critical workload to isolate variables. For example, deploy Prometheus and Grafana alongside your existing monitoring stack. Focus on core metrics like CPU, memory, and latency for a Kubernetes namespace or EC2 instance. This phase validates integration feasibility and identifies gaps in data coverage. Avoid overloading the pilot with complex scenarios—stick to basic observability first.
Phase 2: Metrics and Feedback (Weeks 5-8)
Define success metrics before the pilot ends. Track factors like mean time to detect (MTTD) for synthetic alerts, query latency for dashboards, and team adoption rates. Use a lightweight survey to capture qualitative feedback on tooling usability. Compare these metrics against your baseline to quantify improvements or regressions. This data will justify or refute the pilot’s continuation.
Phase 3: Iterative Rollout (Weeks 9-12)
Expand the pilot to additional workloads if Phase 2 results are positive. Prioritize areas where open-source tools excel—custom dashboards, log aggregation, or cost monitoring—while leveraging managed services for high-velocity data like RUM or APM. Document every decision point, including why certain metrics were prioritized or why a managed service was retained. This transparency builds trust with stakeholders.
Continuous Evaluation
Schedule weekly reviews with your team to discuss pain points and wins. Use a shared document to track open-source tooling limitations (e.g., alerting rules complexity) and managed service dependencies (e.g., vendor lock-in). Adjust the plan every 30 days based on these discussions. For example, if Grafana’s alerting proves cumbersome, consider pairing it with Alertmanager or a managed service for that component.
Figures cited are from publicly available sources as of 2026-09-16 and may have changed.