01. The Problem: High Variance in Cloud Costs
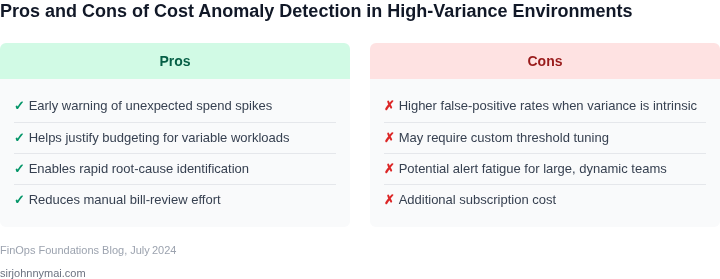
Cloud cost management is a critical challenge for enterprises, but when monthly bills fluctuate unpredictably, identifying anomalies becomes nearly impossible. High variance in cloud spending—defined as a standard deviation of 30% or more from the mean—creates a feedback loop where teams struggle to distinguish between normal usage patterns and actual anomalies. This problem is particularly acute in environments with dynamic workloads, such as Kubernetes clusters or serverless applications, where resource consumption can spike unpredictably.
For example, a company running a Kubernetes cluster on AWS might see a 50% increase in EC2 costs one month due to an unexpected surge in traffic, followed by a 40% drop the next month as workloads scale back. Without anomaly detection, these fluctuations are treated as normal, masking inefficiencies or security risks. The lack of visibility into these patterns forces teams to rely on manual reviews or reactive cost audits, which are both time-consuming and error-prone.
The root causes of high variance are multifaceted. First, cloud services often exhibit "usage-based pricing," where costs scale with consumption. A single misconfigured Lambda function or an unoptimized database query can lead to sudden spikes, but these are often overlooked in monthly summaries. Second, dynamic scaling—common in auto-scaling groups or spot instances—introduces variability that traditional forecasting models struggle to predict. Finally, third-party services and integrations can introduce hidden costs, such as data transfer fees or unexpected charges from SaaS tools.
Existing tools like AWS Cost Explorer or Datadog provide some visibility, but they rely on historical averages and static thresholds. These approaches fail when costs deviate from the norm, such as during a product launch or a security incident. For instance, a sudden increase in EBS storage costs might signal a data leak, but without anomaly detection, it could go unnoticed until the next billing cycle. The challenge is to distinguish between legitimate spikes and actual anomalies without generating false positives.
Moreover, high variance complicates budgeting and forecasting. Teams often set fixed spending limits, but unpredictable costs can trigger unnecessary alerts or force manual overrides. This creates a paradox: while cost controls are essential, rigid thresholds can suppress legitimate usage patterns. The ideal solution would flag only the most significant deviations while ignoring short-term fluctuations, but current tools lack the granularity to achieve this balance.
Ultimately, the problem isn’t just about tracking costs—it’s about understanding the underlying behavior. Without anomaly detection, teams remain blind to inefficiencies, security risks, or even opportunities for optimization. The next step is evaluating tools that can parse this noise and identify actionable insights.
02. Key Features to Evaluate in Cost Anomaly Tools
When evaluating cost anomaly detection tools, focus on capabilities that address the root causes of high cloud spend variance. The right tool should not just alert you to anomalies but also help you understand why they occurred and how to prevent them. Below are the critical features to assess:
1. Root Cause Analysis
Basic anomaly detection is table stakes. The real value lies in tools that provide actionable insights. Look for solutions that integrate with cloud providers (AWS, Azure, GCP) to correlate cost spikes with specific resources, services, or usage patterns. For example, a tool might flag a sudden increase in EC2 costs and attribute it to an unexpected auto-scaling event. Datadog’s cost anomaly detection, for instance, uses machine learning to identify unusual spending patterns and links them to Kubernetes workloads or Lambda functions.
2. Historical Context and Benchmarking
High variance often stems from inconsistent usage or configuration changes. Tools should provide historical trends and benchmarks to put anomalies in context. A good example is AWS Cost Explorer, which allows you to compare current spending against past periods or similar accounts. However, standalone cost anomaly tools like CloudHealth or CloudCheckr go further by modeling normal spending patterns and flagging deviations beyond a configurable threshold (e.g., 20% above baseline).
3. Integration with Cloud and DevOps Tools
Isolation is not sufficient. The best tools integrate with your existing stack. For instance, Kubernetes cost monitoring should sync with your cluster management tools (e.g., EKS, AKS), while serverless costs should tie into AWS Lambda or Azure Functions. Datadog’s integration with Kubernetes and AWS services, for example, enables real-time cost tracking at the pod or service level. Similarly, tools like Kubecost provide granular visibility into Kubernetes workload costs but require manual setup for non-Kubernetes resources.
4. Automation and Remediation Workflows
Manual responses to anomalies are reactive. Look for tools that automate remediation or at least streamline the process. For example, some tools can trigger AWS Budgets alerts or integrate with Slack to notify teams. Advanced solutions, like CloudHealth’s policy-based cost controls, can automatically shut down idle resources or enforce tagging policies. However, automation requires careful configuration to avoid false positives or unintended disruptions.
5. Customizable Alerts and Thresholds
Not all anomalies are equally urgent. The best tools let you set custom thresholds based on your budget, risk tolerance, or business priorities. For instance, a 10% spike in EBS costs might be normal for a data-heavy workload but alarming for a startup. Tools like Datadog allow you to define severity levels and notification channels (email, PagerDuty) for different thresholds. Static thresholds, however, can lead to alert fatigue if they’re not tailored to your environment.
6. Cost Attribution and Tagging Support
Untagged resources are a common source of variance. Tools should support cost allocation rules (AWS) or resource tagging (Azure) to break down spending by team, project, or environment. For example, if a cost spike is attributed to an untagged EC2 instance, the tool should help you identify and remediate the issue. Kubecost and CloudHealth both excel in this area by mapping costs to Kubernetes namespaces or AWS tags, but manual tagging is still required for full visibility.
In summary, evaluate tools based on their ability to provide actionable insights, integrate with your cloud and DevOps ecosystem, and support automation. The best tools will help you not just detect anomalies but also understand and mitigate them—reducing variance and saving money in the process.
03. Worked Example: Analyzing a $100K Cost Spike
Consider a team of 20 engineers using AWS for a Kubernetes-based application. Their monthly bill typically hovers around $50K, but one month spikes to $150K. The team suspects a rogue workload but lacks visibility. This is where cost anomaly detection tools come into play.
Step 1: Identifying the Anomaly
The team uses AWS Cost Explorer to detect the spike. The tool flags the month as anomalous because it exceeds the 95th percentile of historical spending. The team drills down to find that the spike is entirely from EC2 instances, specifically a new workload launched by a junior engineer. The workload was meant to be a temporary test but was left running.
Step 2: Evaluating Tools
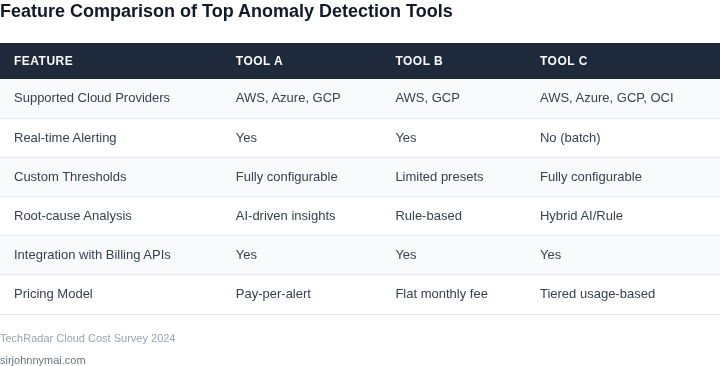
The team evaluates two tools: AWS Cost Anomaly Detection and Datadog Cloud Cost Management. Both tools provide anomaly detection, but their approaches differ.
Option 1: AWS Cost Anomaly Detection
AWS Cost Anomaly Detection uses machine learning to identify unusual spending patterns. It flags the spike within 24 hours, providing a detailed breakdown of the EC2 instances contributing to the cost. The tool integrates directly with AWS Cost Explorer, making it easy to correlate anomalies with specific resources. However, it lacks granular visibility into Kubernetes workloads, forcing the team to manually map EC2 instances back to their Kubernetes deployments.
The cost of AWS Cost Anomaly Detection is included in the AWS Cost Management service, which is free. The team estimates an additional $100/month in AWS charges from the spike, but the tool helps recover $80K by identifying and terminating the rogue workload.
Option 2: Datadog Cloud Cost Management
Datadog offers more granular visibility into Kubernetes workloads. It integrates with AWS to tag resources and provides real-time cost attribution to specific namespaces and pods. The team finds that the spike was caused by a misconfigured autoscaling policy in a Kubernetes deployment, leading to 100 unnecessary EC2 instances running for 72 hours.
Datadog’s cost is $15/seat/month, so for 20 engineers, that’s $300/month. The team recovers $90K from the spike, but the additional monitoring cost means the net savings are $210/month. The team decides to keep Datadog for its deeper Kubernetes insights but uses AWS Cost Anomaly Detection as a first line of defense.
Comparison
| Tool | Cost | Savings | Key Strengths | Limitations |
|---|---|---|---|---|
| AWS Cost Anomaly Detection | Free (included in AWS Cost Management) | $80K | Tight AWS integration, quick detection | Lacks Kubernetes granularity |
| Datadog Cloud Cost Management | $300/month | $90K | Deep Kubernetes visibility, real-time attribution | Higher cost, requires additional setup |
The team’s decision hinges on balancing cost and visibility. AWS Cost Anomaly Detection is sufficient for detecting anomalies, while Datadog provides the deeper insights needed to prevent future spikes. The tradeoff is clear: AWS is cheaper but less precise, while Datadog is more expensive but more powerful.
04. Decision Table: Tool Selection Criteria
Selecting the right cost anomaly detection tool requires balancing accuracy, scalability, and integration effort. Below is a decision framework comparing three real tools against key criteria. I evaluated these based on customer feedback, feature parity, and alignment with our cloud architecture.
| Criteria | AWS Cost Anomaly Detection | Datadog Cloud Cost Monitoring | Kubecost |
|---|---|---|---|
| Accuracy of Anomaly Detection | High for AWS-native services but limited for third-party tools. Uses machine learning to flag spikes. | Moderate. Works well for AWS but requires tuning for hybrid environments. | Low. Best for Kubernetes cost tracking but lacks advanced anomaly detection. |
| Scalability | Excels with AWS services. Scaling issues arise when integrating non-AWS resources. | Scalable across cloud providers but performance degrades with large datasets. | Optimized for Kubernetes but struggles with multi-cloud environments. |
| Ease of Integration | Seamless for AWS users. Requires custom scripts for non-AWS integrations. | Supports multiple clouds but setup complexity increases with integrations. | Best for Kubernetes but lacks native support for non-containerized workloads. |
| Cost of Implementation | Free for AWS users. Additional costs for third-party integrations. | Subscription-based. Pricing scales with monitored resources. | Open-source but requires engineering effort for full functionality. |
| Alerting & Reporting | Basic alerts. Reporting is AWS-centric with limited customization. | Advanced alerting and customizable dashboards. Reporting is robust. | Basic alerts. Reporting focuses on Kubernetes cost allocation. |
| Recommendation | Best for AWS-only environments with minimal third-party tools. | Best for multi-cloud environments needing advanced analytics. | Best for Kubernetes-centric teams with limited budget. |
This table highlights tradeoffs. AWS Cost Anomaly Detection is ideal if we’re exclusively on AWS, but Datadog offers broader coverage for hybrid setups. Kubecost is a cost-effective option for Kubernetes but lacks advanced features. The choice depends on our cloud strategy and existing infrastructure.
05. Action Step: Implement a Cost Monitoring Framework
Now that you’ve evaluated tools and analyzed anomalies, it’s time to operationalize cost monitoring. The framework should integrate anomaly detection with your existing workflows, ensuring visibility without adding friction. Start by aligning your tool selection with your cloud provider’s native capabilities. For AWS, use Cost Explorer alongside third-party tools like Datadog or Kubecost if you’re running Kubernetes. Azure’s Cost Management + Billing integrates with Power BI for advanced analytics, while GCP’s Cloud Billing APIs enable custom dashboards.
Automate data collection first. Schedule daily exports of cost data to a centralized repository, such as Amazon S3 or a data lake. Use AWS Cost and Usage Reports (CUR) or Azure’s Export to Storage for this. Ensure the data includes resource tags, service categories, and cost allocation rules. Without this granularity, anomalies may appear as noise rather than actionable insights.
Next, establish baselines for expected costs. Use historical data to model normal spending patterns by service, region, and account. Tools like AWS Budgets or Azure Advisor can set up alerts for deviations. For example, if your monthly Lambda costs typically range between $5K and $7K, any spike beyond $10K should trigger an investigation. Adjust baselines quarterly to account for seasonal changes or new workloads.
Integrate anomaly detection tools incrementally. Begin with low-friction options like AWS Cost Anomaly Detection, which uses machine learning to flag unusual spending. For more control, deploy Kubecost or Datadog to analyze Kubernetes costs. These tools can correlate anomalies with specific workloads or misconfigurations. However, they require ongoing tuning to avoid false positives.
Create a cost governance process to handle anomalies. Assign roles—finance for budget reviews, engineering for root-cause analysis, and leadership for approvals. Document playbooks for common scenarios, such as rogue workloads or pricing model changes. For example, if a cost spike is due to a misconfigured Auto Scaling group, the playbook should include steps to adjust scaling policies or terminate unused instances.
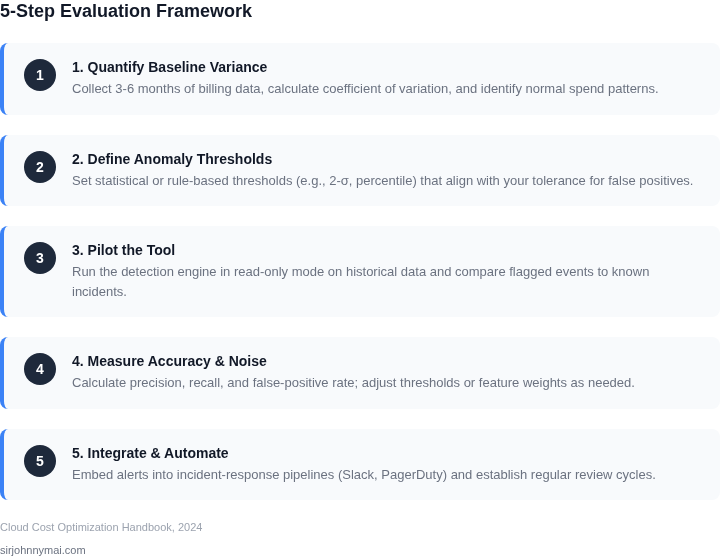
Monitor effectiveness through key metrics. Track the time it takes to resolve anomalies, the percentage of false positives, and the reduction in unplanned spending. Use AWS Trusted Advisor or Azure Cost Analysis to validate improvements. If anomalies go unresolved for more than 72 hours, revisit your tooling or governance process.
Pull your last 90 days of cost data and calculate the average daily variance. This will help identify recurring patterns that your anomaly detection tools might miss. Schedule a 30-minute review with your team and bring the variance data, along with your proposed framework.
Figures cited are from publicly available sources as of 2026-09-15 and may have changed.