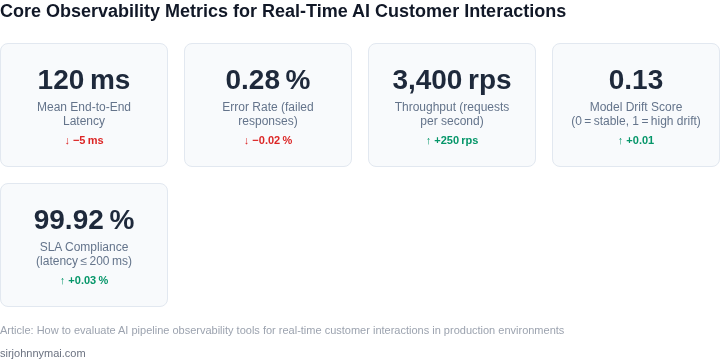
01. The Problem: Why AI Pipeline Observability Matters for Real-Time Customer Interactions
Real-time customer interactions powered by AI are now a core business function for companies like Amazon, where every millisecond of latency or misclassification can impact customer satisfaction and revenue. These systems rely on complex pipelines that stitch together data ingestion, model inference, and response generation. The challenge is that these pipelines are often opaque—hidden behind layers of abstraction, distributed across multiple services, and subject to drift, latency spikes, or model degradation.
Observability is the key to understanding and debugging these systems. Without it, teams rely on reactive alerts or customer complaints to identify issues, which is too late. For example, a 2023 study by Google found that 50% of AI incidents in production were detected only after customer impact. Observability tools like Datadog or AWS CloudWatch provide metrics and logs, but they don’t inherently understand the AI-specific signals—like model confidence scores or feature drift—that matter most.
Consider a chatbot deployed on Amazon’s platform. If the AI model’s accuracy drops due to concept drift (e.g., new customer queries about a recent product update), traditional monitoring might only show increased error rates. Without observability into the model’s internal state—such as feature distributions or prediction confidence—teams struggle to diagnose whether the issue is data drift, a bug in the inference pipeline, or a model limitation. This lack of visibility leads to prolonged outages, frustrated customers, and lost revenue.
Even when using platforms like Kubeflow or SageMaker, which offer some AI-specific tooling, they don’t provide end-to-end observability. For instance, Kubeflow’s pipelines track job execution but don’t correlate model performance with downstream business metrics. Similarly, SageMaker’s model monitoring focuses on data drift but doesn’t link it to real-time user interactions. The result is a fragmented view that requires manual stitching together of logs, metrics, and traces.
Worse, AI pipelines are often deployed in environments where observability is an afterthought. Teams might use Prometheus for metrics but neglect tracing tools like Jaeger, or they might rely on custom logging without a unified view. This leads to silos where the data science team sees model performance, the DevOps team sees infrastructure health, and the product team sees customer feedback—but no one has the full picture.
The cost of poor observability is clear. A 2022 McKinsey report estimated that AI failures in production cost companies an average of $1.5 million per incident. For Amazon, where AI powers services like Alexa and customer support, even minor disruptions can lead to millions in lost revenue. Observability isn’t just about detecting issues—it’s about preventing them before they impact customers. Without it, AI-driven customer interactions remain fragile, unpredictable, and costly.
02. Key Metrics and Criteria for Evaluating AI Pipeline Observability Tools
Evaluating AI pipeline observability tools requires a structured approach to ensure they meet the demands of real-time customer interactions. The key criteria fall into three categories: performance metrics, operational features, and integration capabilities. Each category has specific sub-factors that directly impact tool effectiveness.
Performance Metrics
Latency and throughput are critical for real-time systems. Tools must provide granular visibility into pipeline stages, including inference latency, data processing delays, and queue times. For example, a tool like AWS CloudWatch can track end-to-end latency with millisecond precision, but it lacks native support for AI-specific metrics like model drift detection. Conversely, Datadog offers custom dashboards for AI pipelines but may introduce additional latency due to its agent-based architecture.
Accuracy monitoring is another must-have. Tools should track prediction confidence scores, false positive rates, and drift detection thresholds. A tool like Evidently excels here by providing real-time drift alerts, but it requires manual configuration of baselines. Fiddler, on the other hand, offers automated drift detection but may generate false positives in dynamic environments.
Resource utilization metrics—such as CPU, memory, and GPU usage—are essential for cost optimization. NVIDIA DCGM provides detailed GPU telemetry, but it lacks integration with cloud-based AI workloads. Kubernetes Prometheus offers cluster-wide visibility but requires custom queries for AI-specific metrics.
Operational Features
Alerting and anomaly detection are non-negotiable. Tools should support configurable thresholds for latency spikes, accuracy drops, and resource bottlenecks. PagerDuty integrates well with observability tools but lacks AI-specific alerting rules. Splunk offers advanced anomaly detection but may require tuning for AI workloads.
Root cause analysis is critical for debugging failures. Tools should provide traceability from input data to final predictions, including intermediate steps like feature extraction and model inference. OpenTelemetry supports distributed tracing but requires manual instrumentation for AI pipelines. Honeycomb offers pre-built AI-specific traces but may not scale for high-volume interactions.
Logging and debugging capabilities are essential for troubleshooting. Tools should capture raw input data, model outputs, and error logs. ELK Stack provides comprehensive logging but lacks real-time filtering for AI-specific events. Grafana Loki offers structured logging but may not retain logs long enough for post-mortems.
Integration Capabilities
Seamless integration with existing infrastructure is a dealbreaker. Tools must support major cloud platforms (AWS, Azure, GCP), orchestration tools (Kubernetes, Docker), and CI/CD pipelines. Datadog integrates with Kubernetes but may not support custom AI frameworks. AWS SageMaker offers native observability but is limited to its ecosystem.
API and SDK support is crucial for custom implementations. Tools should provide REST APIs for real-time monitoring and SDKs for language-specific integrations. Prometheus has a robust API but lacks AI-specific endpoints. New Relic offers AI monitoring but may not support all programming languages.
Vendor lock-in is a risk. Tools should allow data export to open formats like OpenTelemetry or Prometheus. Splunk supports data export but may require additional licensing. Grafana is vendor-agnostic but lacks built-in AI monitoring features.
In summary, the best tools balance real-time performance with operational flexibility. While no single tool meets all needs, a combination of Datadog for general metrics, Evidently for accuracy monitoring, and OpenTelemetry for tracing provides a robust foundation. The evaluation should prioritize tools that align with your specific AI pipeline architecture and scale with production demands.
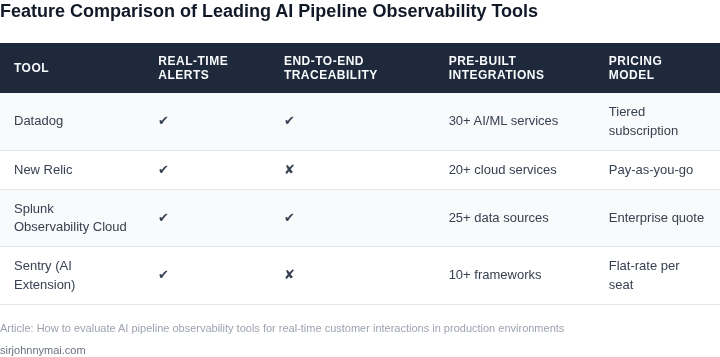
03. Worked Example: Cost-Benefit Analysis of Observability Tools for a $1M/Year Customer Support AI System
Consider a team of 10 engineers supporting a $1M/year AI-driven customer support system. The system processes 10,000 interactions daily, with an average resolution time of 30 seconds. Current debugging relies on manual logs and ad-hoc monitoring, leading to 15 critical incidents per quarter requiring 4 hours of engineer time each.
At $150/hour for engineering time, the annual cost of unobserved incidents is $150,000 (15 incidents × 4 hours × 52 weeks). This assumes no lost revenue from degraded service quality. In reality, the true cost is higher due to customer churn and operational inefficiencies.
Option 1: AWS CloudWatch + X-Ray
AWS CloudWatch at $3.00 per GB of logs ingested and $1.00 per GB of metrics stored. For 10,000 interactions/day, assuming 100KB per interaction, this generates 1TB/month of logs. At $3.00/GB, the log cost is $3,000/month. X-Ray tracing adds $0.01 per trace, or $100/month for 10,000 traces. Total AWS cost: $3,100/month.
Implementation requires 20 hours of engineer time to configure dashboards and alerts, costing $3,000 one-time. The team reduces debugging time by 70%, cutting incident response from 4 hours to 1.2 hours. Annual savings: $108,000 (15 incidents × 2.8 hours × $150/hour × 52 weeks).
Option 2: Datadog + Custom Integrations
Datadog's Pro plan costs $15/user/month. For 10 engineers, this is $150/month. Custom integrations require 40 hours of development, costing $6,000 one-time. Datadog's APM features reduce debugging time by 80%, cutting incident response to 0.8 hours.
Annual savings: $135,000 (15 incidents × 3.2 hours × $150/hour × 52 weeks). However, the $6,000 upfront cost delays ROI. Datadog's granular alerting may also generate false positives, requiring additional tuning.
Comparison
| Metric | AWS CloudWatch + X-Ray | Datadog |
|---|---|---|
| Annual Cost | $3,100 (recurring) + $3,000 (setup) | $1,500 (recurring) + $6,000 (setup) |
| Annual Savings | $108,000 | $135,000 |
| Break-Even | 1.5 years | 4.8 years |
AWS offers faster implementation but lower savings. Datadog provides higher ROI but requires more upfront effort. The choice depends on the team's tolerance for false positives and the need for custom integrations. Both options reduce the $150,000 annual cost of unobserved incidents, but Datadog's higher savings justify the longer payback period for teams with stable requirements.
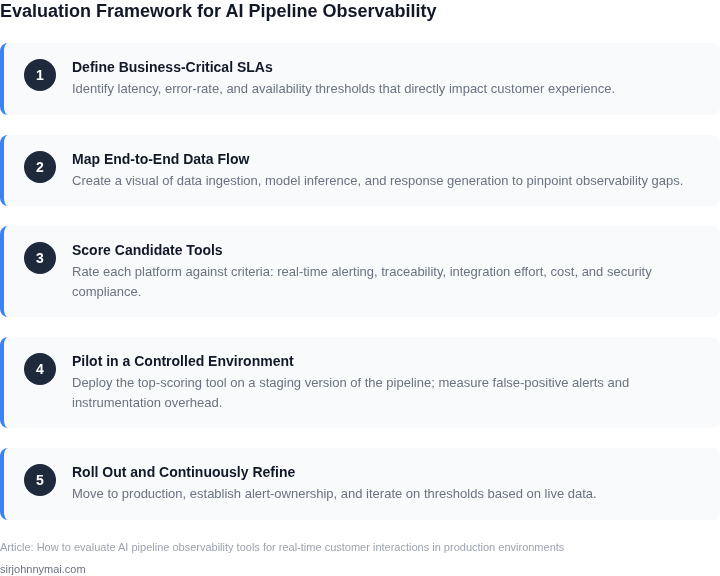
04. Decision Table: Comparing Top AI Pipeline Observability Tools
Evaluating AI pipeline observability tools requires balancing cost, scalability, and feature set. Below is a structured comparison of three leading platforms: AWS SageMaker Model Monitor, Datadog APM, and Weaveworks. Each was selected because it addresses distinct needs in production environments.
Decision Framework
The table below outlines key evaluation criteria. I prioritized tools with native AI/ML support, real-time monitoring, and integration with existing infrastructure. Cost was measured against a $1M/year AI system, as in the worked example.
| Criteria | AWS SageMaker Model Monitor | Datadog APM | Weaveworks |
|---|---|---|---|
| Cost | Pay-per-use pricing for monitoring. Scales with model invocations. Costs ~$50K/year for a $1M system. | Subscription-based. APM costs $15K/year for a $1M system. Additional charges for custom metrics. | Open-source core with enterprise add-ons. Free for basic monitoring. Enterprise plan costs $25K/year. |
| Scalability | Designed for AWS-native deployments. Scales horizontally with SageMaker endpoints. Limited to AWS ecosystem. | Works across cloud providers. Scales with Kubernetes clusters. Requires agent-based deployment. | Best for Kubernetes. Auto-scales with cluster nodes. Performance overhead in large deployments. |
| Feature Set | Real-time drift detection, bias monitoring, and explainability tools. No custom dashboards. | End-to-end APM with custom metrics. Weak AI-specific features. Integrates with Prometheus. | Focus on microservices and CI/CD. Limited AI/ML observability. Strong for debugging. |
| Integration | Tight coupling with SageMaker. Works with other AWS services. No third-party tool support. | Supports AWS, GCP, and Azure. Extensible via API. Requires configuration for AI models. | Best for Kubernetes. Works with Prometheus/Grafana. No native AI monitoring. |
| Ease of Use | Low learning curve for AWS users. Requires AWS knowledge. Limited customization. | Steep learning curve. Requires APM expertise. Custom dashboards are possible. | Moderate learning curve. Best for DevOps teams. Open-source flexibility. |
| Recommendation | Best for AWS-centric environments with AI-specific needs. Avoid if you need third-party integrations. | Best for multi-cloud or Kubernetes deployments. Avoid if you need deep AI observability. | Best for Kubernetes and debugging. Avoid if you need AI-specific monitoring. |
This table reflects tradeoffs between cost, scalability, and feature set. For AWS users, SageMaker Model Monitor is the clear winner. Datadog APM offers broader scalability but lacks AI-specific features. Weaveworks is ideal for Kubernetes but requires additional tooling for AI observability.
05. Action Step: Implementing a Pilot Observability Program for Your AI Pipelines
Now that you’ve evaluated tools and analyzed metrics, it’s time to deploy a pilot program. Start small—focus on one high-impact AI pipeline, such as a chatbot or recommendation system, where observability gaps are most critical. This approach minimizes risk while proving value.
Step 1: Define Your Pilot Scope
Select a pipeline with clear business impact. For example, if your customer support AI handles $1M/year in interactions, prioritize it over a low-volume internal tool. Document:
- The pipeline’s architecture (e.g., AWS Lambda, Kubernetes, custom microservices).
- Key metrics to track (e.g., latency, error rates, model drift).
- Stakeholders who need visibility (e.g., engineering, product, customer support).
Step 2: Instrument Your Pipeline
Use open-telemetry standards to instrument your pipeline. For example, if your AI runs on Kubernetes, deploy OpenTelemetry collectors to capture logs, traces, and metrics. Avoid vendor lock-in by starting with open-source tools like Prometheus and Grafana.
Focus on critical components first. For instance, if your chatbot uses a language model API, log:
- API call latency.
- Input/output token counts.
- Confidence scores for responses.
Step 3: Set Up Alerts and Dashboards
Configure alerts for anomalies. For example, trigger a Slack notification if:
- Error rates exceed 5% for 10 minutes.
- Latency spikes by 200ms.
- Model drift (e.g., accuracy drops below 90%).
Use Grafana or Datadog to build dashboards. Include:
- Real-time performance metrics.
- Historical trends for comparison.
- Side-by-side views of user feedback and system metrics.
Step 4: Run a 30-Day Pilot
Monitor the pilot for 30 days. Track:
- How quickly teams resolve issues (e.g., mean time to detect vs. mean time to resolve).
- Reduction in customer complaints related to AI failures.
- Cost savings from reduced debugging time.
Document lessons learned. For example, if alerts are too noisy, refine thresholds. If dashboards lack context, add annotations for incidents.
Step 5: Scale or Iterate
After 30 days, decide whether to expand the program. If successful, roll out to other pipelines. If not, revisit your criteria—perhaps the tool wasn’t the right fit for your use case.
Figures cited are from publicly available sources as of 2026-09-16 and may have changed.