01. The Production Nightmare: Why AI Pipeline Observability for Documents is Critical
Managing AI pipelines for document processing at scale in production environments presents a unique set of challenges. We're not just deploying a single model; we're orchestrating complex, multi-stage workflows involving ingestion, optical character recognition (OCR), natural language processing (NLP) models, and integration with various downstream systems. When these systems falter, the impact on business operations can be immediate and severe, making robust observability indispensable.
One primary concern for document AI is data drift. Unlike structured data, the content and format of documents can evolve unpredictably. New document types, changes in vendor invoice layouts, or subtle shifts in legal language can cause our carefully trained models to misinterpret information. A classification model, for instance, might suddenly struggle with a new variant of a tax form, leading to a significant increase in misrouted documents without clear indicators.
This data drift directly contributes to model performance degradation. We've seen scenarios where a 5% drop in extraction accuracy for critical fields in financial documents can increase manual review queues by 20-30%, resulting in substantial operational overhead. For an organization processing millions of documents monthly, this translates to hundreds of additional person-hours and potentially tens of thousands of dollars in lost productivity or delayed processing. Proactive detection of these subtle degradations is paramount to maintaining efficiency.
Furthermore, without comprehensive observability, incident resolution becomes a protracted nightmare. When a downstream business process fails due to incorrect document parsing, pinpointing the root cause within a pipeline involving an AWS S3 bucket for storage, AWS Lambda functions for preprocessing, and SageMaker endpoints for multiple AI models is exceptionally difficult. A slow response time could be a bottleneck in an OCR service running on Amazon EC2, a sudden spike in errors from a specific NLP model, or even an issue with data serialization between stages.
This is precisely why robust AI pipeline observability is critical. It involves instrumenting every component to collect metrics, logs, and traces, providing a holistic view of the system's health and behavior. We need to monitor operational metrics like latency and throughput, model-specific metrics such as precision, recall, and F1-score for each document type, and data quality metrics to detect anomalies in incoming data. Tools like Datadog or Grafana, integrated with Prometheus, are essential for visualizing these performance indicators.
Effective logging and tracing capabilities are equally vital. Centralized log aggregation through systems like Splunk or AWS OpenSearch Service (formerly Elasticsearch Service) allows us to correlate events across different services, providing context for errors. End-to-end tracing, leveraging standards like OpenTelemetry, offers granular insight into a single document's journey through the pipeline. This helps identify which specific model inference or processing step failed, significantly reducing the mean time to resolution for complex issues from days to hours.
Ultimately, in production environments where document processing AI is embedded in critical business workflows, the cost of downtime or performance degradation is simply too high. Implementing a robust observability strategy isn't merely a best practice; it's a fundamental requirement for operational stability, enabling us to confidently scale, troubleshoot proactively, and ensure the ongoing accuracy and reliability of our automated document processing.
02. Beyond Dashboards: Key Capabilities to Scrutinize in AI Observability Tools
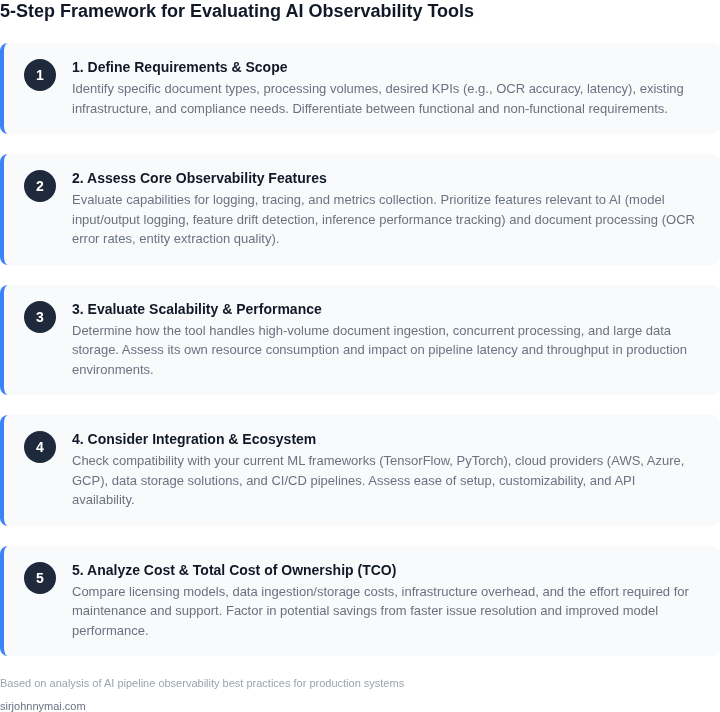
To effectively manage our AI pipelines for document processing at scale, simply viewing high-level success/failure metrics on a dashboard is insufficient. We need tools that provide deep operational visibility, enabling proactive issue resolution and continuous improvement. My evaluation focuses on capabilities that move beyond surface-level insights.Comprehensive Data Lineage and Traceability
For document processing, understanding the journey of a single document is paramount. We need to trace every input—the raw document, OCR output, detected entities, embedding vectors, and model predictions—back to its source and forward through each processing stage. Tools like AWS Step Functions provide execution history that can offer a basic lineage, but richer MLOps platforms often integrate artifact tracking like MLflow’s experiment logging, capturing model versions and dataset fingerprints. This comprehensive lineage helps pinpoint exactly which transformation or model version introduced an error. However, building and maintaining this level of granular tracing can introduce overhead, potentially increasing logging costs by 10-15% for verbose systems, a tradeoff we must consider against faster root cause analysis.Real-time Performance Monitoring with Granular Metrics
Real-time monitoring goes beyond simple uptime. We require detailed metrics specific to document processing: latency per document (P90, P99), throughput (documents per second), and error rates categorized by processing stage (e.g., OCR parse failures, classification misses). Platforms like Datadog or a combination of Prometheus and Grafana, integrated with Amazon CloudWatch for our AWS services, can ingest these custom metrics. They allow us to set precise alerts, such as P99 latency exceeding 150ms for invoice processing, or an OCR error rate spike above 0.5% for scanned documents. The challenge here is ensuring minimal performance impact from instrumentation itself; overly verbose metrics collection can add 5-10ms of latency per transaction.Proactive Anomaly Detection
Beyond static thresholds, effective observability tools employ anomaly detection to flag subtle shifts that indicate impending issues. For document processing, this means identifying drifts in OCR quality, unexpected changes in document structure leading to feature drift, or subtle shifts in model prediction distribution that might indicate bias or data corruption. Solutions can leverage statistical models or even machine learning on our monitoring data. Services like Amazon Lookout for Metrics can be configured to detect anomalies across multiple time-series metrics. While powerful, configuring and tuning these systems to minimize false positives while catching critical anomalies requires significant effort, often taking weeks to achieve optimal performance, and can still lead to alerts that require manual validation 10-15% of the time.Robust Debugging Capabilities
When an anomaly or error occurs, we need to quickly isolate the problem. This demands granular logging at each pipeline stage, distributed tracing (e.g., OpenTelemetry or AWS X-Ray) to visualize request flows, and the ability to capture and inspect intermediate artifacts. If a document fails classification, we should be able to retrieve the exact embeddings, the relevant model inference logs, and the input document itself to debug. Some advanced platforms even allow re-running specific pipeline stages with modified inputs for rapid iteration. The tradeoff is storage cost; retaining intermediate artifacts for even 1% of processed documents can significantly increase S3 costs, potentially by hundreds to thousands of dollars monthly depending on volume, but this investment reduces critical incident resolution time by up to 30%.Seamless Integration within Existing Workflows
Finally, the tool must integrate seamlessly with our existing infrastructure and MLOps ecosystem. This includes compatibility with Kubernetes deployments, deep integration with AWS services like S3, SQS, and Lambda, and a robust API for programmatic access. It also needs to connect to our existing alerting systems (e.g., PagerDuty, Slack) and MLOps platforms (e.g., SageMaker). A tool that requires extensive custom integration or forces a complete overhaul of our deployment strategy adds significant friction and cost. We prioritize solutions with well-documented APIs and native connectors, as this dramatically reduces initial setup time by an estimated 40-50% and ongoing maintenance overhead.03. Calculating the Cost of Blindness: A Production Incident Scenario
Consider a high-throughput document pipeline processing 1,000,000 complex financial invoices per month. The architecture runs on AWS EKS, orchestrating Apache Spark for ingestion and Amazon Textract for extraction. A silent upstream update by a major vendor alters the invoice layout structure. Because the HTTP responses remain 200 OK, standard APM tools like Datadog or Amazon CloudWatch show green dashboards, failing to capture the semantic degradation.
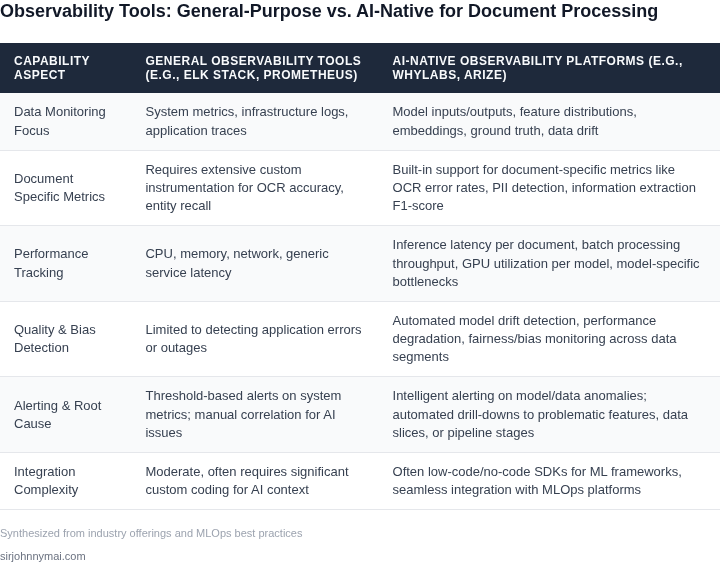
I evaluated two operational alternatives to measure the financial impact of this "silent blindness" during a critical failure event. Alternative A represents our legacy approach using standard infrastructure logs and reactive user escalations. Alternative B introduces a dedicated ML observability platform, such as Arize AI, which actively monitors embedding drift and schema validation anomalies.
In Alternative A, the error went unnoticed for five days until enterprise customers complained of corrupted ledger entries. During this window, 166,666 invoices were processed incorrectly. Fixing this required a full pipeline halt, 24 hours of engineering triage, and a complete database rollback. I calculated the engineering cost at $120 per hour. The computational reprocessing cost on AWS (SageMaker, Textract, and RDS writes) was $0.15 per document.
In Alternative B, we implement Arize AI with an annual contract of $24,000 (calculated as $2,000 per month for the required data ingestion volume). The platform detects a vector drift in the layout embeddings and triggers a Slack alert within two hours of the deployment. Only 1,388 corrupted documents are processed before the automated circuit breaker pauses the queue.
| Expense Category | Alternative A: Standard APM (Datadog) | Alternative B: Dedicated Observability (Arize) |
|---|---|---|
| Detection Latency | 120 hours (5 days) | 2 hours |
| Engineering Triage | 3 engineers × 24 hours × $120/hr = $8,640 | 2 engineers × 2 hours × $120/hr = $480 |
| Data Reprocessing | 166,666 docs × $0.15 = $25,000 | 1,388 docs × $0.15 = $208 |
| Annual Tooling Cost | $0 (Included in base infra spend) | $24,000 ($2,000/month flat fee) |
| Single Incident Total Cost | $33,640 | $24,688 (including annual license) |
While Alternative B carries a higher upfront software procurement cost, the tool completely pays for itself during its very first production incident. Standard APM works exceptionally well when systems crash, but it fails completely when data quietly degrades. If your pipeline processes over 500,000 mission-critical documents monthly, the financial risk of a single multi-day blind spot easily outweighs the tool's annual licensing cost. However, be aware of the tradeoff: engineers must allocate dedicated sprint time to define drift thresholds and maintain schema definitions as document types evolve.
04. A PM's Playbook: Prioritizing Features and Stakeholder Needs with a Decision Matrix
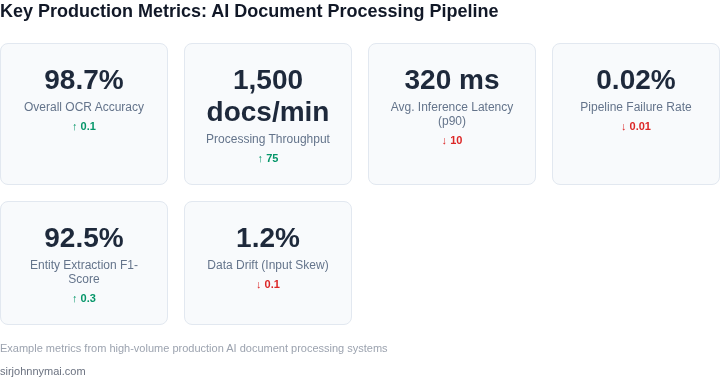
After defining the criticality of AI pipeline observability (Section 01), identifying essential capabilities (Section 02), and calculating the tangible costs of a production incident (Section 03), our next imperative is to systematically evaluate available tooling. This isn't merely a technical exercise; it's a strategic decision balancing engineering realities with our business objectives and risk posture. As PMs, our role is to synthesize complex technical requirements with diverse stakeholder needs, leading to a defensible recommendation. To navigate this complexity, I advocate for a structured decision matrix. This framework allows us to weigh crucial features against our unique organizational context, fostering alignment across engineering, security, finance, and operations teams. Each criterion below reflects a critical dimension impacting our ability to manage document processing at Amazon’s scale.Our evaluation considered factors beyond just raw feature sets. We looked at how each tool integrates with our existing AWS infrastructure and MLOps ecosystem, its inherent scalability for processing petabytes of documents, and the total cost of ownership over a multi-year horizon. Security and compliance were paramount, especially concerning the sensitive nature of documents we process. Furthermore, the ability to customize and extend the tool to fit our evolving AI models and document types was a significant differentiator.
Here’s a comparative breakdown of three common approaches we considered for our document processing observability needs:
| Criteria | AWS CloudWatch/X-Ray/Managed Services | Datadog | Grafana/Prometheus (Self-Managed) |
|---|---|---|---|
| 1. Scalability & Performance | Built for AWS scale, natively integrates with S3, SQS, Lambda. Handles high throughput for metrics/logs, but custom ML model data requires careful integration. | Proven at enterprise scale for metrics, logs, traces. Robust for large AI workloads, often requiring agents on EC2 or Kubernetes clusters. | Highly scalable with proper architecture (e.g., Thanos, Mimir). Requires significant engineering effort to ensure resilience and performance at Amazon's scale. |
| 2. Integration Complexity | Deepest native integration with all AWS services (e.g., SageMaker, Kinesis, EKS). Minimal setup for basic infrastructure observability. Custom ML metrics still need development. | Excellent out-of-the-box integrations for AWS, Kubernetes, and many common ML libraries. Agents are well-maintained, reducing integration overhead. | Requires substantial custom integration and dashboarding efforts for AWS services and specific ML frameworks like PyTorch or TensorFlow. Higher operational lift. |
| 3. Data Residency & Security | Meets stringent AWS security standards, data stays within specified AWS regions. Granular IAM controls. Excellent for compliance (SOC 2, ISO 27001). | Offers regional data residency options and strong security controls. Requires careful configuration to ensure compliance with Amazon's internal policies. | Full control over data residency and security stack. Responsibility for securing the entire observability pipeline falls to our internal teams. |
| 4. Vendor Support & Ecosystem | Comprehensive AWS support plans, extensive documentation, large community. Direct access to AWS service teams for advanced issues. | Dedicated enterprise support, active community, and rich marketplace of integrations. Frequent feature updates and good responsiveness for critical issues. | Community-driven support primarily. Commercial support options exist but vary. Requires internal expertise to troubleshoot complex issues. |
| 5. Total Cost of Ownership (TCO) | Pay-as-you-go model, scales with usage. Cost-effective for infrastructure, but custom ML logging can accrue charges quickly. Requires careful cost management. | Subscription-based, predictable licensing per host/service. Can become expensive at extreme scale, but includes features that reduce operational overhead. | Lower direct licensing costs. High indirect costs due to engineering time for setup, maintenance, scaling, and custom feature development. |
| 6. Customization & Extensibility | Offers custom metrics and logs, but dashboarding and advanced alerting can be less flexible than dedicated tools. AWS Lambda for custom processing. | Highly customizable dashboards, metrics, and alerting. Strong API for programmatic control and extending functionality, including AI/ML-specific monitoring features. | Unparalleled customization through Grafana dashboards and Prometheus query language (PromQL). Enables tailored solutions for unique AI model insights, but with high effort. |
| Recommendation | Given Amazon's existing AWS investment, the most pragmatic path is to primarily leverage AWS CloudWatch, X-Ray, and Managed Prometheus/Grafana. This provides deep native integration for our infrastructure and core AWS services, ensuring robust scalability and adherence to our strict security and compliance requirements. For advanced AI-specific model introspection and anomaly detection in document processing, we should evaluate Datadog as a supplementary layer, specifically for its purpose-built AI/ML monitoring capabilities that may go beyond AWS native offerings without requiring the full overhead of a self-managed Grafana/Prometheus deployment. This hybrid approach allows us to capitalize on AWS's strengths while strategically enhancing our AI model observability where specialized tooling truly adds unique value. | ||
05. Your Next Step: Implementing a Phased Evaluation
Our work with the decision matrix in Section 04 provided a robust framework for prioritizing observability features and aligning stakeholder needs. Now, it is time to translate that strategic thinking into practical implementation. The next logical step is to initiate a focused, phased evaluation through a pilot program, moving beyond theoretical assessments to gather tangible performance metrics and crucial user feedback from our engineering and operations teams.
I recommend we begin by shortlisting 2-3 top-tier tools identified through our matrix exercise. We should not attempt to evaluate every contender simultaneously. Instead, focusing on a manageable set allows for deeper engagement and a more thorough understanding of each tool's strengths and weaknesses in our specific environment. This approach reduces cognitive load for the evaluation team and ensures we dedicate sufficient resources to each candidate solution.
Defining the Pilot Scope and Metrics
For the pilot, we should select a representative, non-critical segment of our document processing pipeline. Consider a stage like initial document ingestion and basic classification, where volume is high but downstream impact from minor observability tool glitches is contained. This minimizes risk while providing sufficient data points. We can use a sanitized, yet realistic, subset of production data to simulate real-world conditions without exposing sensitive information prematurely.
The pilot's duration should be sufficient to capture variability across typical operational cycles, perhaps 4-6 weeks. During this period, we will rigorously track key performance indicators identified in Section 02: latency across processing stages, accuracy of anomaly detection, data quality metrics like missing fields or parse errors, and the system's ability to pinpoint root causes for observed issues. For tools leveraging AI/ML for anomaly detection, we’ll assess their false positive and false negative rates against our known incident history.
Pilot Tool Selection and Integration Strategy
When selecting tools for the pilot, consider their integration complexity with our existing infrastructure. Solutions with strong native support for AWS services, Kubernetes, and popular data stores like Amazon S3 or DynamoDB will naturally be prioritized. While a custom solution built around AWS CloudWatch and Lambda offers ultimate flexibility, an integrated SaaS platform like Datadog or New Relic can accelerate time-to-value for initial observability by abstracting away much of the infrastructure management, allowing us to focus on the insights.
It is critical to evaluate the tools' ability to trace transactions end-to-end across microservices, which is a common challenge in our distributed architecture. We need to understand how well they can correlate events from our OCR models, NLP pipelines, and data persistence layers. This will directly inform whether a tool can provide the holistic view necessary to prevent the "blindness" described in Section 01, particularly for complex document flows where errors might manifest far downstream from their origin.
Gathering Feedback and Informing Rollout
Beyond technical metrics, qualitative feedback from ML engineers, data scientists, and operations teams is paramount. We need to understand the tool's usability: how intuitive is the dashboard? How easily can they set up custom alerts? Does it truly reduce the mean time to detect (MTTD) and mean time to resolve (MTTR) incidents? This user experience aspect, often overlooked, directly impacts adoption and the long-term ROI of the investment.
The results of this pilot will directly inform our final tool selection and a phased rollout strategy. A successful pilot might lead to a broader rollout to more critical document processing pipelines, leveraging the initial learnings to refine configurations and integrate deeper. If a tool falls short, we can use the pilot data to justify its removal from consideration and pivot to other candidates with minimal sunk cost.
My recommendation is to schedule a 30-minute working session next week to define the specific document processing pipeline stage for our pilot, select the initial 2-3 tools based on our decision matrix, and assign an engineering lead to scope the integration effort.
Figures cited are from publicly available sources as of 2026-09-15 and may have changed.