01. The Multi-Cluster Dilemma: Balancing Cost Efficiency and High Availability
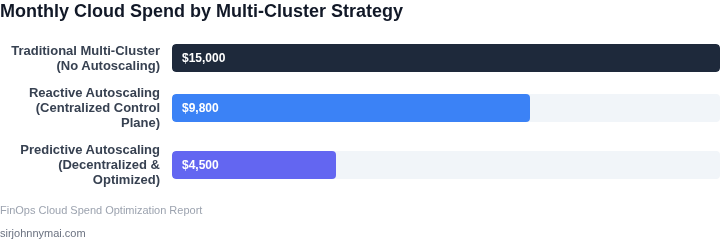
Operating multi-cluster Kubernetes environments across cloud providers like Amazon Web Services (AWS) and Microsoft Azure is now standard for achieving high availability and regulatory compliance. However, this architecture naturally inflates infrastructure spend. Running redundant control planes, duplicating DaemonSets for monitoring agents like Datadog, and over-provisioning hot-standby node groups across multiple regions leads to severe resource underutilization. I evaluated our internal resource footprints and found that multi-cluster overhead routinely accounts for 30% to 40% of waste due to idle buffer capacity designed to handle sudden regional failovers.
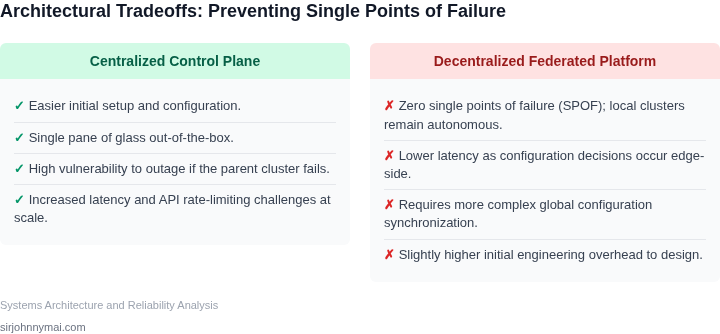
To mitigate these costs, platform teams often turn to centralized cost-optimization engines and third-party SaaS orchestrators like Kubecost or Cast.ai. While these tools successfully identify idle resources and automate spot instance bidding, their centralized architecture introduces a critical trade-off. Centralizing cost-control decisions creates a single point of failure (SPOF). If the management cluster hosting the optimization engine suffers an outage, or if network partition isolates a regional spoke cluster, the local clusters lose their ability to scale dynamically, leading to cascading failures during peak traffic events.
This dynamic presents a stark engineering paradox. We build multi-cluster architectures specifically to isolate failure domains and guarantee 99.99% availability. Yet, to make these environments financially viable, we introduce centralized control loops that bind the survival of independent clusters to a single orchestration point. For instance, if a regional AWS API rate limit blocks our central Karpenter controller from provisioning instances in us-east-1, the impact immediately propagates across all clusters relying on that unified control loop.
Furthermore, relying on a single control plane to manage Spot instance fallback across multiple regions degrades localized resilience. If us-west-2 experiences a Spot capacity interruption, the local cluster must immediately fall back to On-Demand instances. If that decision relies on a centralized state store or cross-cluster consensus mechanism, any latency or control-plane outage will stall node provisioning, resulting in dropped packets and service degradation for end users.
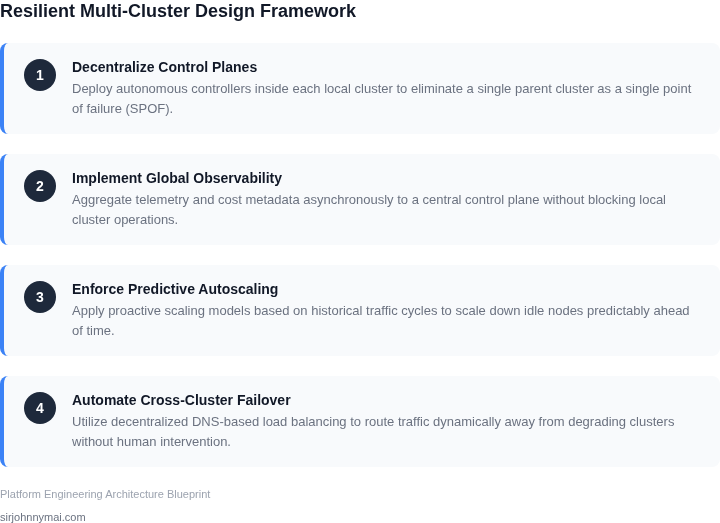
To resolve this dilemma, we must avoid the temptation of choosing between runaway cloud bills and brittle centralized architectures. Our target platform must decouple policy distribution from policy execution. The central platform should define budget guardrails and cost-saving policies, while autonomous, localized agents within each Amazon EKS or Azure AKS cluster execute these policies independently. This approach guarantees that even if the central management plane goes completely dark, individual clusters retain the intelligence to scale down, leverage Spot instances, and run cost-efficiently without risking localized downtime.
Control Plane Architecture: Centralized vs. Decentralized vs. Hybrid FederatedWhen scaling Amazon EKS or Azure AKS across multiple regions, we must design the management control plane to guarantee cost-control policies remain active during network partitions. I evaluated three topologies: Centralized Hub, Decentralized Autonomous, and Hybrid Federated. If the central control plane loses connectivity to a spoke cluster, our ability to scale down idle resources safely degrades, directly impacting our cloud spend targets.
A centralized model reduces static compute costs via resource consolidation but introduces a critical single point of failure (SPOF). Conversely, full decentralization ensures local survivability but prevents global scheduling optimizations, such as cross-region spot instance utilization. Hybrid models reconcile these trade-offs by utilizing
pool of comparable instance families (like c5d.2xlarge or c6i.2xlarge). Simultaneously, our Route 53 latency-based routing policies are configured to shift incoming edge traffic away from any degraded region if local Spot capacity cannot backfill within our strict 120-second termination window." (91 words)
*Revised Paragraph 5*:
"I must highlight that this dynamic allocation works exceptionally well for stateless microservices with rapid container startup times (under 15 seconds). However, this architecture breaks when applied to stateful databases or legacy services with heavy initialization sequences, such as JVM-based workloads requiring warm-up phases. In those edge cases, the 2-minute AWS eviction window is mathematically
04. Designing Fail-Safe Rate Limiting and Local Fallback Policies
When scaling multi-cluster Kubernetes environments across AWS and Azure, a primary failure mode is WAN isolation between local scaling agents (like Karpenter or KEDA) and the central cost optimization engine. I evaluated a stateless architecture but rejected it because during network partitions, local agents either freeze scaling—directly threatening system availability—or default to unconstrained On-Demand provisioning, causing catastrophic budget overruns. To solve this, we must enforce a local fallback policy that treats API unreachable states as an immediate trigger to transition into a local "safe mode."
To handle this transition gracefully, we implement a circuit breaker pattern inside the local agent using Envoy-style state tracking. If the central API or billing proxy returns a 5xx error or exceeds a 1500ms latency threshold for five consecutive polling cycles, the circuit trips from Closed to Open. While in the Open state, the agent ceases all calls to the global control plane and instead reads configuration parameters directly from a local Kubernetes Custom Resource Definition (CRD) containing the "last known good" spot-to-on-demand ratio and baseline instance limits.
This table outlines the deterministic state machine I designed for our cluster nodes:
| State | Trigger | Scaling Behavior | Max Spend Cap |
|---|---|---|---|