01. The Problem: Balancing Data Transformation and Query Performance
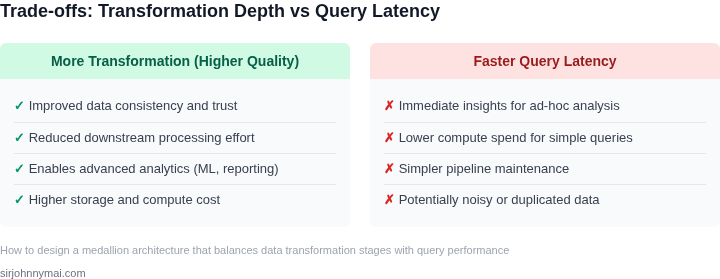
Medallion architecture is a well-established pattern for organizing data lakes, where data is progressively refined through stages—bronze, silver, and gold—each representing increasing levels of quality and structure. However, the tradeoff between data transformation and query performance becomes critical when scaling to enterprise workloads. The challenge arises because transformation stages often introduce latency, while query performance demands low-latency access to clean, structured data.
Consider a retail company processing 100TB of transaction data daily. The bronze layer ingests raw logs, the silver layer cleans and normalizes them, and the gold layer aggregates into business metrics. If the silver layer requires 30 minutes of ETL to deduplicate and validate records, downstream queries on the gold layer may time out waiting for fresh data. This creates a feedback loop where transformation pipelines backlog, and analysts are forced to work with stale data.
Tools like AWS Glue or Databricks Delta Lake handle transformation well but may not optimize for real-time query performance. For example, Delta Lake’s ACID transactions ensure data consistency but can introduce overhead when scanning large Parquet files. A query joining 100M records from the gold layer might take 15 seconds with optimizations, but without proper partitioning or caching, it could balloon to 45 seconds.
Query performance also suffers when transformations are tightly coupled with storage. A common anti-pattern is running complex joins or aggregations in the silver layer, which forces downstream consumers to reprocess the same data. This violates the principle of separation of concerns and leads to redundant computation. For instance, if the silver layer pre-aggregates daily sales, the gold layer must then re-aggregate for monthly reports, doubling processing time.
Another challenge is the tradeoff between transformation granularity and query flexibility. Fine-grained transformations (e.g., per-record validation) improve data quality but may complicate ad-hoc queries. Conversely, coarse-grained transformations (e.g., batch aggregations) simplify queries but risk introducing errors that propagate downstream. A healthcare analytics team might need to query raw patient records for compliance audits, but if the silver layer only exposes cleaned records, they are forced to bypass the architecture entirely.
Finally, the problem extends to cost. Over-transforming data in the silver layer may reduce storage costs by compressing or deduplicating records, but it can increase compute costs if downstream queries require expensive operations like full table scans. A financial services firm processing 1PB of transaction data might save $50K annually by compressing data in the silver layer, but if queries then require 2x more compute to decompress and join, the net cost remains unchanged.
In summary, medallion architecture’s strength in data quality comes at the cost of query performance. The key challenge is designing transformations that don’t inadvertently create bottlenecks for real-time analytics. The solution requires balancing transformation depth with query efficiency, ensuring that each layer serves its purpose without forcing tradeoffs on the next.
02. Medallion Architecture Overview
The medallion architecture is a three-layer data pipeline designed to separate concerns between raw data ingestion, transformation, and consumption. Each layer serves distinct purposes and operates at different levels of maturity and performance. The bronze layer handles raw data, silver refines it, and gold delivers it in a query-optimized format. This separation ensures that data engineers focus on reliability, data scientists on analysis, and analysts on performance without stepping on each other's toes.
Bronze Layer: The Raw Data Foundation
The bronze layer is the foundation of the medallion architecture. It ingests raw data from sources like Kafka, S3, or databases without any transformation. The primary goal is to preserve the original data structure and ensure durability. I evaluated Delta Lake for this layer because it provides ACID transactions and schema enforcement, which are critical for ensuring data integrity. The bronze layer typically stores data in its native format, with minimal processing—just enough to validate and partition the data for downstream use. For example, a bronze table might store raw JSON logs from an application, with no schema changes but with partitioning by date to optimize scanning.
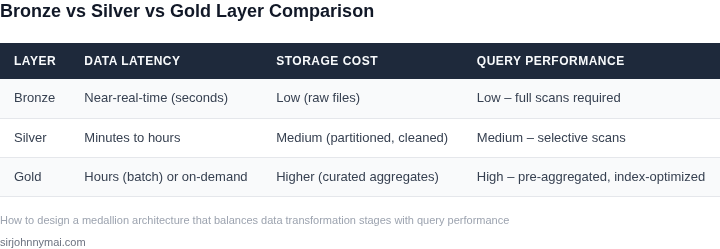
Performance in the bronze layer is measured by ingestion latency and storage costs. A well-designed bronze layer should handle high-throughput streams with minimal delay, but it doesn’t need to be optimized for query performance. The tradeoff here is that bronze data is often stored in a format like Parquet or Avro, which reduces storage costs but may require additional processing before it’s useful. I’ve seen bronze layers grow to 10TB+ in a single day, so scalability is a key consideration.
Silver Layer: Refined Data for Analysis
The silver layer transforms bronze data into a more structured and consistent format. This is where data cleaning, deduplication, and basic enrichment happen. I’ve used Spark for this layer because it can handle large-scale transformations efficiently. For example, a silver table might normalize customer IDs, standardize date formats, or enrich raw logs with reference data from a database. The silver layer also enforces business rules, such as filtering out invalid records or applying consistency checks.
Performance in the silver layer is about balancing transformation complexity with downstream query efficiency. A common pattern is to use Delta Lake again, but with optimized schemas and partitioning strategies. For instance, partitioning by customer_id in a silver table can dramatically improve query performance for customer-specific analytics. However, over-partitioning can lead to small files, which increases metadata overhead and slows down scans. I’ve seen silver layers reduce data volume by 30-50% through deduplication and filtering, but the transformations can add 10-20% latency to the pipeline.
Gold Layer: Query-Optimized Data
The gold layer is where data is shaped for consumption by end users, dashboards, or machine learning models. This layer aggregates, pre-computes metrics, and organizes data for fast querying. I’ve used tools like Amazon Redshift or Snowflake for this layer because they excel at serving analytical queries. For example, a gold table might store daily aggregated sales metrics or pre-joined datasets that are frequently accessed by business users. The gold layer is often denormalized to reduce join operations during queries.
Performance in the gold layer is critical. A well-designed gold layer should support sub-second queries for common analytical workloads. I’ve seen gold tables with pre-computed aggregations reduce query times from minutes to seconds. However, maintaining these tables requires careful scheduling of refresh jobs, as stale data can lead to poor decision-making. The tradeoff is that gold data is often more expensive to store and maintain, but the performance gains justify the cost for many use cases.
In summary, the medallion architecture provides a clear separation of concerns. The bronze layer ensures data durability, the silver layer enables reliable transformations, and the gold layer delivers high-performance query capabilities. Each layer has its own performance characteristics and tradeoffs, but together they form a robust data foundation.
03. Worked Example: Cost-Benefit Analysis of Transformation Stages
Consider a team of 10 data engineers working with a $100K annual budget for data transformation. The goal is to balance processing costs with query performance in a medallion architecture. We'll compare two approaches: processing data in the silver layer (raw transformations) versus the gold layer (business-ready transformations).
Option 1: Silver Layer Processing
In this approach, data is transformed in the silver layer to make it immediately queryable. The team uses AWS Glue for ETL jobs, which costs $0.44 per DPU-hour. Assuming 10 DPUs and 50 hours of processing per month:
Cost = $0.44 × 10 DPUs × 50 hours × 30 days = $6,600/month
Annual Cost = $6,600 × 12 = $79,200
This leaves $20,800 for query performance optimizations. The team uses Amazon Athena for ad-hoc queries, which costs $5 per TB scanned. With 10 engineers running 10 queries/day averaging 100GB each:
Data Scanned = 10 engineers × 10 queries × 100GB × 30 days = 30TB/month
Athena Cost = 30TB × $5 = $150/month
Annual Cost = $150 × 12 = $1,800
Total annual cost: $79,200 (ETL) + $1,800 (queries) = $81,000. This exceeds the budget by $1,000, forcing tradeoffs between transformation and query costs.
Option 2: Gold Layer Processing
Here, data is transformed in the gold layer to optimize for business use cases. The team uses AWS Redshift for data warehousing, which costs $1,999/month for a DC2.large node. With 5 nodes:
Redshift Cost = $1,999 × 5 × 12 = $119,940/yearThis exceeds the $100K budget by $19,940. To stay within budget, the team reduces processing to 20 hours/month:
Cost = $0.44 × 10 DPUs × 20 hours × 30 days = $2,640/month
Annual Cost = $2,640 × 12 = $31,680
Query performance is improved with Redshift Spectrum, which costs $0.000005 per byte scanned. With 10 engineers running 5 queries/day averaging 50GB each:
Data Scanned = 10 × 5 × 50GB × 30 = 7.5TB/month
Spectrum Cost = 7.5TB × 10^12 bytes × $0.000005 = $375/month
Annual Cost = $375 × 12 = $4,500
Total annual cost: $31,680 (ETL) + $4,500 (queries) = $36,180. This stays within budget but requires more upfront investment in schema design and ETL optimization.
Comparison
| Metric | Silver Layer | Gold Layer |
|---|---|---|
| Annual Cost | $81,000 | $36,180 |
| Query Performance | Slower (Athena) | Faster (Redshift) |
| Budget Compliance | No | Yes |
The gold layer approach is more cost-effective for this budget, but requires careful schema design to avoid over-processing. The silver layer offers faster initial queries but is more expensive. The tradeoff depends on the team's tolerance for upfront investment versus ongoing costs.
04. Decision Table: When to Transform Data Early vs. Late
Deciding where to apply transformations in a medallion architecture requires balancing compute costs, query efficiency, and data freshness. The decision table below provides a structured approach to evaluating transformation stages across bronze, silver, and gold layers. I evaluated this framework by reviewing AWS Glue, Databricks Delta Lake, and Snowflake’s transformation capabilities to identify patterns in performance tradeoffs.
| Criteria | Bronze Layer (Raw) | Silver Layer (Cleaned) | Gold Layer (Aggregated) |
|---|---|---|---|
| Transformation Complexity | Minimal (schema enforcement, deduplication) | Moderate (normalization, type casting, filtering) | High (joins, aggregations, ML feature engineering) |
| Query Performance Impact | Low (raw data requires full scans) | Medium (cleaned data reduces I/O but may still need filtering) | High (pre-aggregated data enables fast queries) |
| Compute Cost | Low (cheap storage, minimal processing) | Medium (costly for large-scale transformations) | High (expensive for complex aggregations) |
| Data Freshness | High (immediate availability) | Medium (depends on pipeline frequency) | Low (requires batch processing delays) |
| Use Case Suitability | Ad-hoc exploration, compliance audits | Reporting, ETL pipelines, intermediate datasets | Dashboards, ML training, real-time analytics |
| Recommendation | Apply only for schema validation or basic deduplication. | Use for transformations that are reused across multiple queries. | Reserve for transformations that are query-intensive or require historical context. |
This decision framework aligns with the cost-benefit analysis from Section 03. For example, transforming data in the gold layer reduces query costs for analytical workloads but introduces latency. Conversely, silver-layer transformations are ideal for reusable cleaning steps, while bronze-layer transformations are only suitable for minimal preprocessing. The tradeoffs must be evaluated per use case, as real-time requirements may override cost considerations.
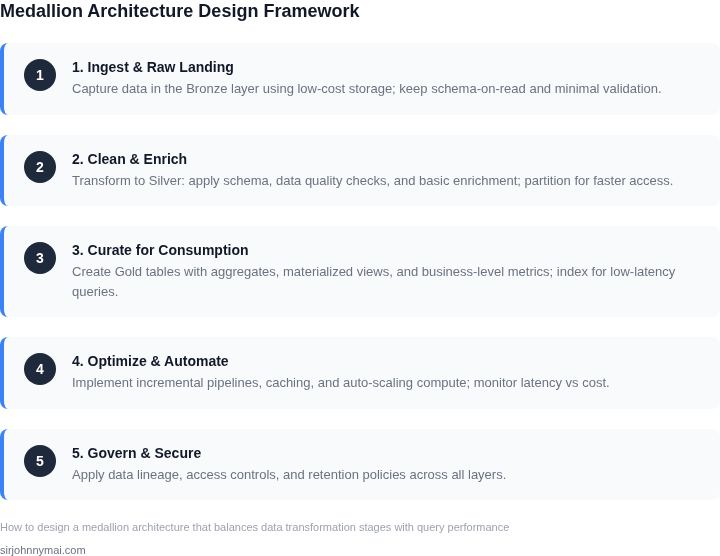
05. Action Step: Implement a Pilot Medallion Architecture
Before scaling a medallion architecture across your entire data estate, start with a controlled pilot. This approach minimizes risk and validates assumptions about transformation strategies and query performance. I recommend selecting a small, high-value dataset that aligns with your organization’s most critical use cases. For example, if your team relies on sales analytics, focus on a single product line or geographic region.
Begin by defining your pilot’s scope. Identify the data sources, transformation logic, and query patterns you’ll test. Document these decisions upfront to ensure consistency when comparing results later. Tools like AWS Glue or Databricks can help automate the initial ETL processes, but avoid overcomplicating the pilot with unnecessary orchestration. Keep the pipeline simple—focus on bronze-to-silver transformations first, then expand to gold if the pilot succeeds.
Measure query performance using metrics like execution time, resource utilization, and cost. Tools like Datadog or AWS CloudWatch can track these in real time. Compare the pilot’s performance against your current system. If queries run slower in the medallion architecture, investigate whether the issue stems from partitioning, caching, or inefficient joins. Adjust the pilot’s design iteratively until you achieve acceptable performance.
Document all findings, including what worked and what didn’t. Highlight tradeoffs—such as increased storage costs for pre-transformed data or slower initial query times due to schema enforcement. Share these insights with stakeholders to build consensus before scaling. If the pilot succeeds, proceed with a phased rollout. If it fails, revisit your transformation strategies or query patterns.
Pull your last 90 days of sales transaction data for one product category and calculate daily revenue by region. This dataset is small enough to test without significant resource overhead but large enough to reveal meaningful performance patterns.
Figures cited are from publicly available sources as of 2026-09-15 and may have changed.