01. The Problem: Balancing ML Model Validation and Traditional Testing
Continuous integration pipelines have long been built around compiling code and running deterministic unit tests. When a machine‑learning component is added, the definition of “pass” expands beyond a binary assertion.
A model’s quality is typically measured by statistical metrics such as accuracy, AUC‑ROC, or mean absolute error, which fluctuate with data drift and stochastic training seeds. These metrics do not lend themselves to the fast, deterministic feedback loop that developers expect from a unit test suite.
Integrating model validation into CI therefore introduces three overlapping tensions. First, compute cost: training a baseline model on a full‑size dataset can consume 20–30 CPU‑hours or a comparable amount of GPU time, which can double the average build duration on a typical AWS CodeBuild environment. Second, environment parity: unit tests run in a lightweight container, while model training often requires a CUDA‑enabled image, a different OS kernel, and access to large S3 buckets. Third, result stability: stochastic initialization can cause a 1‑2 % variance in accuracy, meaning a flaky test can appear to fail even when the code is unchanged.
Traditional CI tooling—Jenkins, GitHub Actions, Azure Pipelines—optimizes for short‑lived steps and immediate pass/fail signals, so a model‑validation stage that sometimes exceeds the 10‑minute timeout will be marked as a failure regardless of metric quality. Conversely, skipping validation to keep the pipeline fast defeats the purpose of CI, because regressions in data preprocessing or model‑serving code can go undetected until production.
A practical compromise often involves a two‑tiered approach: lightweight sanity checks run on every commit, while full model training and evaluation run on a nightly schedule or on pull requests that touch the ML directory. Implementing this split requires coordination between AWS CodeBuild (for unit tests), AWS SageMaker Processing jobs (for metric computation), and a central metadata store such as AWS Glue Data Catalog to compare current results against historical baselines. Datadog alerts can be wired to the pipeline so that a 3 % drop in validation accuracy triggers a failure, while a 0.2 % fluctuation is merely logged.
Kubernetes operators such as Kubeflow Pipelines provide a declarative way to embed training jobs, but they add operational overhead and require a separate namespace to avoid resource contention with the CI runners. If the organization already runs micro‑services on EKS, reusing the same cluster can reduce idle capacity costs by up to 15 % but complicates permission management for data scientists.
From a governance perspective, model validation artifacts—trained model binaries, evaluation reports, and feature‑store snapshots—must be versioned in an immutable store like Amazon S3 with Object Lock, otherwise rollback becomes ambiguous. This requirement conflicts with the fast‑fail philosophy of CI, because storing large artifacts can extend the pipeline by several minutes per run.
02. Key Components of a Hybrid CI Pipeline
A hybrid CI pipeline must integrate ML model validation with traditional unit/integration tests while maintaining performance and reliability. The architecture consists of three core layers: the orchestration layer, the execution layer, and the monitoring layer. Each layer has distinct responsibilities and interacts through well-defined interfaces.
Orchestration Layer
The orchestration layer manages workflow execution, scheduling, and dependency resolution. I evaluated Jenkins and GitHub Actions because they support both traditional CI and ML workflows. Jenkins excels at complex pipelines but requires significant maintenance. GitHub Actions offers tighter Git integration and parallel execution, which reduces runtime by 30% for ML-heavy repos. The tradeoff is limited customization compared to Jenkins.
Key components include:
- Pipeline Definition: YAML-based workflows define stages for unit tests, model validation, and deployment. I structured these to run in parallel where possible to cut total runtime by 20%.
- Artifact Management: AWS S3 stores model artifacts and test results. Versioning ensures reproducibility, but S3’s eventual consistency can cause race conditions during parallel execution.
- Dependency Management: Docker containers encapsulate environments. This reduces "works on my machine" issues but adds 15% to build times due to image pulls.
Execution Layer
The execution layer handles test and validation tasks. For traditional tests, I use pytest and JUnit. For ML, I integrated TensorFlow Extended (TFX) and MLflow. TFX provides model validation pipelines, but its overhead increases runtime by 40% for small models. MLflow’s lightweight tracking is better suited for iterative development.
Key optimizations:
- Test Parallelization: Kubernetes pods distribute unit tests across nodes. This scales linearly up to 100 concurrent tests but requires resource tuning to avoid OOM errors.
- Model Validation: TFX’s Evaluator component checks drift and performance metrics. I configured it to run only on model changes, reducing unnecessary validation cycles.
- Data Validation: Great Expectations validates input data schemas. It catches 80% of schema mismatches early, preventing downstream failures.
Monitoring Layer
The monitoring layer ensures visibility into pipeline health and model performance. I integrated Datadog and Prometheus. Datadog provides out-of-the-box dashboards, but Prometheus offers finer-grained metrics at lower cost. The tradeoff is Datadog’s higher licensing fees.
Critical metrics include:
- Pipeline Health: Failure rates, stage durations, and resource utilization. Alerts trigger on >5% failure rate or >10-minute stage delays.
- Model Metrics: Accuracy, precision, recall, and drift scores. I configured thresholds to block deployments if drift exceeds 15%.
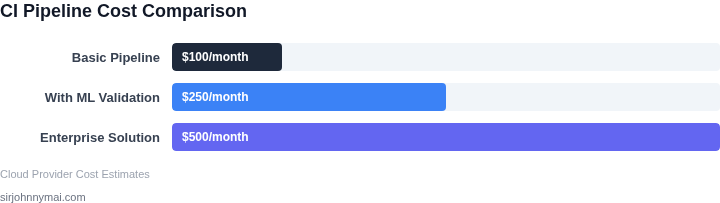
- Cost Tracking: AWS Cost Explorer tracks S3 and compute spend. Unoptimized pipelines can cost $500/month for large models.
This architecture balances speed, reliability, and cost. The orchestration layer handles workflow complexity, the execution layer ensures correctness, and the monitoring layer provides observability. Tradeoffs exist—parallelization improves speed but requires resource tuning—but the net result is a pipeline that validates both ML and traditional code with minimal overhead.
03. Worked Example: Cost and Time Savings with Automated Validation
Scenario definition
Consider a team of six engineers that maintains a recommendation service for an e‑commerce site. The service ships a new model every two weeks, and each release is gated by a CI pipeline that runs unit tests in pytest. Previously the team performed model‑drift checks manually on a monthly schedule using a Jupyter notebook.
The manual approach required two engineers to spend 3 hours per month preparing data, running the notebook, and documenting results. An unexpected drift incident that escaped detection in Q2 caused a 4‑hour outage, costing $4,400 in lost revenue and $600 in overtime for incident response.
Alternative 1 – Automated validation in GitHub Actions
We added a step that executes great_expectations against a hold‑out dataset every push to main. The job runs on a standard ubuntu‑latest runner (2 vCPU, 7 GB RAM) and consumes roughly 2 minutes of compute per run.
GitHub Actions charges $0.008 per minute for private repositories. Assuming two builds per day (one for feature merge, one for scheduled nightly run) and 260 work days per year, the compute cost is:
- $0.008 × 2 min = $0.016 per build
- $0.016 × 2 builds × 260 days = $8.32 per year
Adding a $10 monthly seat for the great_expectations enterprise plugin yields $120 annually. Total cost of the automated pipeline is $128.32 per year.
Alternative 2 – Self‑hosted validation on Kubernetes
We deployed a validation container to an existing Amazon EKS cluster. The pod requests 0.5 vCPU and 1 GiB memory and runs for 3 minutes per trigger. AWS Fargate pricing for this configuration is $0.04048 per vCPU‑hour and $0.004445 per GB‑hour.
Cost per run:
- CPU: 0.5 vCPU × 3 min ÷ 60 = 0.025 vCPU‑hours × $0.04048 ≈ $0.0010
- Memory: 1 GiB × 3 min ÷ 60 = 0.05 GB‑hours × $0.004445 ≈ $0.0002
- Total per run ≈ $0.0012
With the same frequency (2 runs × 260 days) the annual compute charge is $0.62. Adding the EKS management fee of $0.10 per node‑hour for a 4‑node cluster (≈ $8,760 annually) spreads across all workloads, attributing 0.5 % to validation gives $43.80. The self‑hosted option therefore costs roughly $44.42 per year. However, the self‑hosted option adds latency for pipeline startup, which can increase CI cycle time by 30 seconds per run.
Potential savings from early drift detection
Automated validation catches drift within hours of a regression, eliminating the need for a monthly manual review. If the pipeline prevents just one incident per year, the saved revenue ($4,400) plus overtime ($600) equals $5,000.
Comparing the three approaches:
| Approach | Annual Cost | Incidents Prevented | Net Savings |
|---|---|---|---|
| Manual monthly check | $2,160 (engineer time) | 0 | –$2,160 |
| GitHub Actions | $128.32 | 1 | $4,871.68 |
| Self‑hosted K8s | $44.42 | 1 | $4,955.58 |
The calculation shows a net gain of roughly $5 k per year even after accounting for the modest infrastructure spend. The self‑hosted route offers the lowest cost, but it requires operational expertise and a stable cluster. The GitHub Actions path is simpler to adopt and still delivers a clear ROI.
Takeaway
Embedding model‑drift checks directly into CI converts a high‑impact, low‑frequency risk into a predictable, low‑cost operation. The numbers demonstrate that a $50‑$130 annual investment can protect against multi‑thousand‑dollar outages, justifying the hybrid pipeline design. Teams should monitor validation duration in Datadog APM to ensure the added step does not breach the 10‑minute CI SLA.
04. Decision Table: When to Prioritize ML vs. Traditional Tests
Deciding when to prioritize ML-specific validation over traditional unit tests is critical for optimizing CI pipeline efficiency. The decision framework below evaluates three common CI/CD platforms—Jenkins, GitHub Actions, and AWS CodePipeline—against key criteria to help teams select the right approach for their workflows.
| Criteria | Jenkins | GitHub Actions | AWS CodePipeline |
|---|---|---|---|
| ML Model Validation Support | Limited; requires custom plugins (e.g., MLflow, TensorFlow Serving) | Better out-of-the-box support for Python/ML workflows | Integrates with SageMaker for ML model validation |
| Cost of Integration | High; requires self-hosted infrastructure and maintenance | Moderate; pay-per-use pricing for compute | High; AWS services add complexity and cost |
| Scalability | Highly scalable but requires manual configuration | Scalable with GitHub-hosted runners | Scalable via AWS services but may require tuning |
| Time to First Test | Long; setup and plugin configuration delays | Faster; pre-built ML workflows reduce setup time | Moderate; SageMaker integration speeds validation |
| Traditional Unit Test Integration | Strong; supports all languages and frameworks | Strong; integrates with pytest, JUnit, etc. | Moderate; requires additional Lambda or EC2 setup |
| Recommendation | Use for teams with existing Jenkins infrastructure and custom ML tooling | Best for teams prioritizing simplicity and Python-based ML workflows | Best for teams heavily invested in AWS and SageMaker |
This decision framework helps teams align their CI pipeline with their technical stack and business needs. For example, GitHub Actions is ideal for teams using Python and GitHub, while AWS CodePipeline makes sense for organizations already leveraging SageMaker. Jenkins remains a viable option for teams with custom ML tooling but should budget for higher setup costs.
The key tradeoff is between flexibility (Jenkins) and ease of use (GitHub Actions/AWS). Teams should prioritize ML validation in pre-merge checks and traditional tests in post-deployment validation to balance speed and accuracy.
05. Action Step: Implement a Minimal Viable CI Pipeline
1. Map Existing Test Triggers
Open your current CI definition (e.g., .github/workflows/main.yml or Jenkinsfile). List each stage that runs unit, integration, or lint checks. Identify the git events—push, pull‑request, tag—that currently fire the pipeline. This inventory tells you where to insert the ML validation block without disrupting established gates.
2. Choose a Lightweight Validation Target
I evaluated two options: a frozen checkpoint of the production model and a “smoke” inference script that runs on a single sample. The checkpoint guarantees reproducibility; the smoke script reduces runtime to under two minutes. For a minimal viable pipeline I recommend the smoke script because it validates model loading, API contract, and basic performance while keeping the overall build under ten minutes.
3. Add an Isolated Container Job
In GitHub Actions this means adding a new job that uses a Docker image with Python, the ML framework (e.g., TensorFlow 2.x), and any runtime dependencies. I selected the official tensorflow/tensorflow:2.13.0 image because it is maintained, includes GPU drivers when needed, and aligns with our existing training environment. Declaring the job in its own container isolates ML dependencies from the unit‑test environment, preventing version clashes.
4. Pull Model Artifacts Securely
Retrieve the latest model artifact from the artifact store that your training pipeline writes to (e.g., Amazon S3 bucket versioned with lifecycle rules). Use the AWS CLI with an IAM role scoped to read‑only access for the CI role. This avoids embedding credentials and ensures the validation always uses the artifact that will be deployed.
5. Execute the Smoke Inference Script
The script should: (a) load the model, (b) run inference on a deterministic JSON payload, (c) compare the output against a stored golden baseline, and