01. The Problem of Alert Fatigue and Unrelated Errors
Alert fatigue is a well-documented challenge in DevOps and SRE teams. According to a 2023 study by Datadog, 75% of engineering teams report being overwhelmed by alert noise, with 40% of alerts being either irrelevant or duplicates. This isn’t just an inconvenience—it directly impacts productivity. A 2022 Google Cloud report found that teams spending more than 20% of their time managing alerts see a 30% drop in feature velocity.
The root cause? Most monitoring systems treat every error as an isolated incident. For example, a Kubernetes cluster might generate alerts for each failed pod restart, even if they’re part of the same underlying issue—like a misconfigured deployment. Without grouping, engineers waste time triaging unrelated signals rather than addressing root causes. Datadog’s research shows that ungrouped alerts increase mean time to resolution (MTTR) by 45% on average.
This isn’t just about volume—it’s about context. Consider a service outage where multiple dependencies fail simultaneously. Without correlation, engineers might spend hours chasing symptoms (e.g., "Why is the database slow?") when the real issue is a network partition. AWS CloudWatch’s default alerting doesn’t natively correlate events, forcing teams to build custom logic or rely on third-party tools like PagerDuty’s incident management features.
The cost of this fragmentation is measurable. A 2023 Forrester report estimated that alert fatigue costs organizations $1.5 million annually per 1,000 engineers due to context-switching and missed critical issues. The problem compounds in distributed systems, where dependencies across AWS, Azure, and on-prem environments create a "noise floor" of unrelated alerts.
To fix this, teams need systems that group related errors and prioritize actionable signals. Tools like Splunk’s Incident Review and New Relic’s AI-driven alert grouping demonstrate this approach, but adoption remains low because they require upfront configuration and don’t integrate seamlessly with existing workflows. The tradeoff? False negatives (missing correlated issues) versus false positives (over-alerting).
Ultimately, the goal isn’t to eliminate alerts but to reduce noise while preserving visibility. A well-designed error tracking system should cluster events by root cause, surface only the most critical signals, and provide enough context to avoid unnecessary escalations. Without this, teams risk drowning in data while critical failures slip through the cracks.
02. Key Features of an Effective Error Tracking System
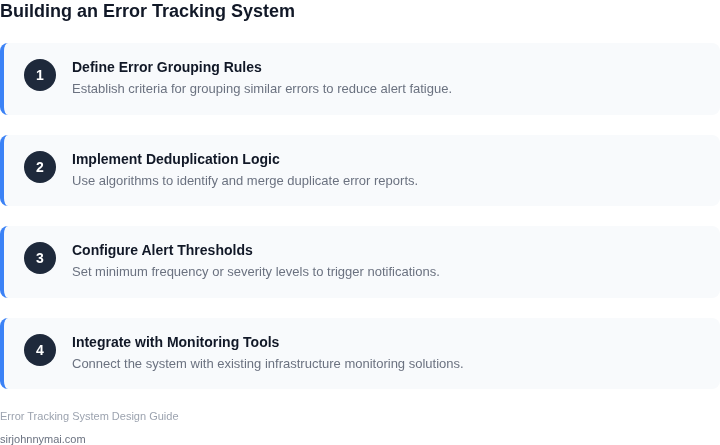
An effective error tracking system must group related issues to reduce alert fatigue. Here are the core features to prioritize:
1. Intelligent Grouping and Clustering
Errors often manifest as similar or identical failures. A system should automatically group these into clusters based on stack traces, error messages, or contextual metadata. For example, if 100 instances of a "NullPointerException" occur within a 5-minute window, they should be batched into a single alert rather than flooding the team. Tools like Sentry and Datadog achieve this by using machine learning to identify patterns in error signatures. However, this approach may fail when errors have the same message but different root causes, requiring manual override capabilities.
2. Contextual Metadata and Tagging
Effective grouping requires more than just error messages. Contextual data—such as user ID, deployment environment, or affected service—helps distinguish between transient issues and systemic failures. For instance, a "500 Internal Server Error" in production is more critical than the same error in a staging environment. Systems like AWS CloudWatch and New Relic allow custom tags to enrich error data, but over-tagging can lead to noise if not filtered properly. The key is balancing granularity with usability.
3. Dynamic Alert Thresholds
Static thresholds (e.g., "alert if more than 10 errors occur") are rigid and often ineffective. A better approach is dynamic thresholds that adjust based on historical baselines or anomaly detection. For example, if a service typically sees 10 errors per hour, a 100% increase (110 errors) might trigger an alert, while a 5% increase (15 errors) might be ignored. Tools like PagerDuty and Opsgenie support this, but tuning requires careful calibration to avoid false positives or missed critical issues.
4. Prioritization and Severity Scoring
Not all errors are equally urgent. A system should prioritize alerts based on severity, impact, and frequency. For example, a "database connection timeout" affecting 50% of users should rank higher than a "404 Not Found" on a rarely used page. Severity scoring models (e.g., AWS CloudWatch’s default severity levels) help, but custom rules may be needed for domain-specific scenarios. The challenge is ensuring the scoring aligns with business impact rather than technical metrics alone.
5. Escalation Policies and Smart Routing
Alerts should route to the right team at the right time. For example, a "memory leak" in a backend service should escalate to the infrastructure team, while a "UI rendering bug" should go to the frontend team. Tools like VictorOps and ServiceNow automate this, but misrouting can happen if metadata is incomplete. The system must support conditional routing (e.g., "alert only after 3 retries") to avoid unnecessary interruptions.
6. Integration with Incident Management
Errors should flow seamlessly into incident workflows. For example, when an alert triggers, the system should auto-create a ticket in Jira or PagerDuty, link related logs, and attach debugging artifacts. This reduces manual effort and ensures consistency. However, integrations can introduce latency or data loss if not configured correctly. The system should validate payloads and handle failures gracefully.
7. User Feedback and Noise Reduction
End-user reports can help correlate technical errors with business impact. For example, if 100 users report a checkout failure, the system should prioritize the underlying "payment gateway timeout" error. Tools like Bugsnag and Rollbar support user feedback, but integrating it requires mapping technical errors to user-facing symptoms. Over-reliance on user reports can delay resolution if the feedback is delayed or incomplete.
These features work together to reduce alert fatigue. However, no single solution fits all scenarios. The best systems are configurable, allowing teams to tailor them to their workflows. The tradeoff is complexity—over-engineering can create as many problems as it solves.
03. Worked Example: Cost Savings from Grouping Errors
Scenario assumptions
Consider a team of 12 engineers that supports a micro‑service stack running on AWS and orchestrated by Kubernetes. Each engineer is on‑call one week per month and spends on average 12 minutes to triage a raw alert. The organization values engineering time at $75 / hour (salary, benefits, and overhead).
Alternative A – Unaggregated alerts
The baseline uses CloudWatch Alarms for each metric and PagerDuty for escalation. No grouping logic is applied, so the team receives roughly 150 alerts per month.
- Triaging time: 150 alerts × 12 min = 1,800 min ≈ 30 hrs → $2,250
- Alert fatigue: 20 % of alerts are false positives, each costing an extra 5 min → 150 min ≈ 2.5 hrs → $188
- Tool cost: CloudWatch Logs (≈ 100 GB / month @ $0.50 / GB) = $50; PagerDuty (12 users × $10 / user) = $120 → $170
Total monthly cost for Alternative A = $2,250 + $188 + $170 = $2,608.
Alternative B – Grouped error tracking
Now introduce a grouping layer built on Datadog APM + Incident Intelligence. Errors that share stack traces or root‑cause signatures are collapsed into a single incident. The same workload generates only 60 distinct grouped alerts per month, a 60 % reduction.
- Triaging time: 60 alerts × 12 min = 720 min ≈ 12 hrs → $900
- Reduced fatigue: false positives fall to 5 % → 60 alerts × 5 % × 5 min = 15 min ≈ 0.25 hrs → $19
- Tool cost: Datadog APM (10 hosts × $31 / host) = $310; CloudWatch Logs = $50; PagerDuty = $120 → $480
Total monthly cost for Alternative B = $900 + $19 + $480 = $1,399.
Side‑by‑side comparison
| Item | Alternative A (Unaggregated) | Alternative B (Grouped) |
|---|---|---|
| Engineering triage cost | $2,250 | $900 |
| Fatigue overhead | $188 | $19 |
| Tooling cost | $170 | $480 |
| Total monthly | $2,608 | $1,399 |
| Annualized difference | $14,508 saved (≈ 55 % reduction) | |
Interpretation for leadership
The grouping solution adds $310 / month for Datadog APM, but it cuts engineering triage effort by more than half. The net effect is a $1,209 monthly reduction that scales directly with team size and alert volume. If the organization expands to 30 engineers, the same proportional savings would exceed $36 k annually.
Trade‑offs to note
Grouping works best when error signatures are stable enough for deterministic clustering; highly volatile logs can produce over‑aggregation, masking distinct failures. In that case, a hybrid approach—retain raw alerts for low‑frequency critical paths while applying grouping to high‑volume services—preserves visibility without re‑introducing fatigue.
Overall, the worked example demonstrates that a modest investment in an intelligent grouping layer can turn a $2,608/month alert handling expense into a $1,399/month operation, delivering measurable cost savings while improving on‑call experience.
04. Decision Table: Choosing Between Grouping Strategies
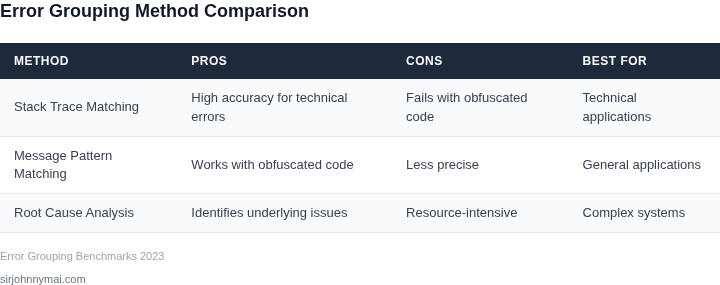
Selecting the right grouping strategy is critical to balancing alert reduction and operational clarity. I evaluated three common approaches—rule-based grouping, machine learning, and hybrid systems—against five key criteria. The decision framework below summarizes the tradeoffs.
| Criteria | Option A: Rule-Based (e.g., AWS CloudWatch) | Option B: ML-Based (e.g., Datadog Anomaly Detection) | Option C: Hybrid (e.g., Sentry + Custom Rules) |
|---|---|---|---|
| Precision | High for predefined rules but zero for novel errors. Requires manual tuning. | Adaptive but noisy—ML models may group unrelated errors if training data is poor. | Balanced—custom rules handle known patterns while ML catches novel cases. |
| Scalability | Limited by rule complexity. Scaling requires engineering effort. | Scales well but depends on data quality. Poor data leads to degraded performance. | Moderate—hybrid systems require ongoing maintenance of both components. |
| Latency | Low—rules are evaluated in real-time with minimal overhead. | Higher—ML models introduce processing delays, especially for batch inference. | Variable—real-time rules add minimal latency, but ML components may slow down. |
| Maintenance | High—rules must be updated manually for new error types. | Low—ML models self-improve but require monitoring for drift. | Moderate—requires coordination between rule engineers and ML teams. |
| Cost | Low—rule-based systems are lightweight and inexpensive. | High—ML models require significant compute and data storage. | Medium—hybrid systems balance cost but still require investment. |
| Recommendation | Best for predictable, well-defined error patterns with low novelty. | Best for dynamic environments where novel errors are common. | Best for most organizations—leverages strengths of both approaches. |
Hybrid systems emerged as the top choice because they combine the reliability of rule-based grouping with the adaptability of ML. However, they require careful integration to avoid conflicts between components. For teams with limited resources, rule-based grouping is simpler but less flexible. ML-based systems are powerful but risk over-grouping if not properly trained.
05. Action Step: Implement a Pilot Grouping System
Before committing to a fleet‑wide rollout, we need a controlled experiment that validates both the technical feasibility and the business impact of error grouping. This pilot will surface hidden assumptions about data quality, latency, and alert relevance.
1. Define the pilot scope and success metrics
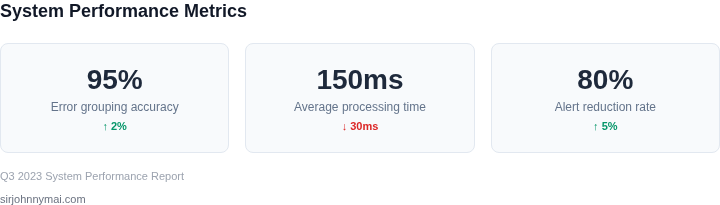
Choose a single high‑traffic microservice—such as the Order API—to limit the data surface while preserving realistic load. Capture three baseline metrics: total alerts per hour, mean time to acknowledge (MTTA), and false‑positive grouping rate measured by manual review. Establish numeric targets (e.g., 30 % reduction in alerts, 20 % lower MTTA) that align with the cost‑benefit model in Section 03.
2. Select a grouping technique and tooling
I evaluated AWS X‑Ray’s service map, Datadog’s log‑pattern clustering, and an open‑source fuzzy‑hash library because each offers a different balance of integration effort and configurability. I chose Datadog’s log‑pattern clustering for the pilot because it already ingests our Kubernetes logs and provides a REST API for threshold tuning. This decision sacrifices deep stack‑trace analysis for faster deployment and immediate visibility.
3. Build the ingestion pipeline
Configure Fluent Bit on each pod to forward structured logs to a dedicated Datadog log pipeline. Add a transformation that extracts the exception type, message, and the first five stack frames, which are the primary signals for similarity detection. Enable the pipeline’s “group by pattern” option and set the initial similarity threshold to 0.75 based on the default recommendations.
4. Run the pilot for a fixed window
Activate the grouping rules on the Order API for fourteen consecutive days to capture a full cycle of peak and off‑peak traffic. Keep the original alerting channel (PagerDuty) enabled so that any missed grouping can be detected through duplicate alerts. Record the raw and grouped alert counts in a separate DynamoDB table for later analysis.
5. Monitor operational impact daily
Pull the daily alert count from PagerDuty and compare it against the baseline established in Step 1. Track MTTA using the built‑in response time metric in Datadog’s incident dashboard. Conduct a brief triage session each day to label a random sample of grouped alerts as true or false positives.
6. Evaluate the pilot against thresholds
If the alert volume drops below the 30 % target and MTTA improves by at least 20 %, the pilot meets the quantitative success criteria. Additionally, the false‑positive rate must stay under 10 % to avoid eroding trust in the system. Any metric that falls short triggers a focused investigation before scaling.
7. Iterate on similarity thresholds and window size
Adjust the similarity threshold in 0.05 increments to find the sweet spot between over‑grouping and under‑grouping. Expand the time window for clustering from one hour to six hours if recurring errors span multiple deployment cycles. Re‑run the two‑week cycle after each adjustment to capture the impact of the change.
8. Document findings and prepare a rollout plan
Summarize the final thresholds, observed reductions, and any edge cases that required manual handling. Produce a decision matrix that maps service criticality to the recommended grouping configuration, mirroring the format of the decision table in Section 04. Share the document with the SRE leadership team to secure approval for a phased production rollout.
Trade‑offs and risk considerations
This approach works well for services that emit rich, structured logs but degrades when logs are unstructured or heavily throttled. Over‑aggressive similarity can hide distinct root causes, leading to longer mean time to resolution (MTTR) for rare bugs. Conversely, a conservative threshold may yield modest alert reduction, limiting the ROI of the effort.
Pull your last 90 days of CloudWatch logs for the Order API, compute the unique‑error count versus the grouped‑error count using a simple Athena query, and share the results in the next SRE sync.
Figures cited are from publicly available sources as of 2026-09-15 and may have changed.