01. The Problem: Why Infrastructure Cost Attribution is Hard
I evaluated various cloud infrastructure cost attribution tools because accurate cost allocation is crucial for our organization's financial planning and budgeting. However, I found that existing tools often fall short in providing actionable insights without adding significant manual overhead. For instance, AWS Cost Explorer provides detailed cost and usage reports, but it requires significant configuration and tagging to accurately attribute costs to specific teams or services.
A key challenge is that cloud infrastructure costs are often intertwined across multiple teams and services, making it difficult to accurately allocate costs. I observed that even with tools like Kubernetes, which provides resource utilization metrics, it is still challenging to attribute costs to specific applications or services. This is because Kubernetes clusters often run multiple applications, and the cost of the underlying infrastructure is not easily attributable to individual applications.
Another challenge is the dynamic nature of cloud infrastructure, where resources are constantly being spun up or down, and usage patterns change frequently. I found that tools like Datadog, which provide real-time monitoring and analytics, can help identify cost anomalies, but they often require significant configuration and customization to provide actionable insights. Furthermore, the sheer volume of data generated by these tools can be overwhelming, making it difficult to identify meaningful trends and patterns.
To make matters worse, the lack of standardization in cost attribution methodologies across different cloud providers and tools adds to the complexity. I evaluated the cost attribution capabilities of various cloud providers, including AWS, Azure, and Google Cloud, and found that each provider has its own methodology and set of tools, making it challenging to compare costs across providers. For example, AWS uses a pay-as-you-go pricing model, while Azure uses a pre-paid subscription model, making it difficult to accurately compare costs between the two providers.
In terms of actual costs, I found that the manual overhead of tracking cloud spend can be significant, with some estimates suggesting that up to 20% of IT staff time is spent on cost tracking and optimization. This can translate to tens of thousands of dollars per year in labor costs alone, not to mention the opportunity cost of not having accurate and timely cost insights. For instance, a company with $1 million in annual cloud spend may spend up to $200,000 per year on labor costs associated with cost tracking and optimization.
Given these challenges, it is clear that building an infrastructure cost attribution tool that surfaces actionable insights daily without adding maintenance burden is a complex task. I will outline the key requirements and design considerations for such a tool in the next section, including the need for automation, integration with existing tools and platforms, and a user-friendly interface that provides meaningful insights and recommendations.
Some of the key tradeoffs that need to be considered when building such a tool include the level of granularity required for cost attribution, the frequency of data updates, and the level of automation versus manual configuration. For example, a tool that provides real-time cost updates may require significant infrastructure and labor investments, while a tool that provides daily or weekly updates may be more cost-effective but less timely. I will explore these tradeoffs in more detail in the next section.
Ultimately, the goal of an infrastructure cost attribution tool is to provide accurate and timely cost insights that can inform business decisions and optimize cloud spend. I believe that by leveraging existing tools and platforms, such as AWS Cost Explorer and Kubernetes, and integrating them with automation and machine learning capabilities, we can build a tool that provides actionable insights without adding significant manual overhead.
02. Key Requirements for a Low-Maintenance Solution
Building a cost attribution tool that delivers actionable insights without becoming a maintenance burden requires careful planning. The key is to design for automation, simplicity, and integration with existing systems. Here are the must-have features:
1. Automated Data Collection
The tool must ingest cost data from multiple sources—AWS Cost Explorer, Kubernetes cost metrics, and third-party tools like Datadog—without manual intervention. I evaluated AWS Cost and Usage Reports (CUR) because they provide granular, machine-readable data, but they require S3 bucket setup and Lambda functions for processing. The tradeoff is that while this is reliable, it adds initial complexity. For Kubernetes, I considered Prometheus and its cost exporter, which works well for cluster-level costs but requires ongoing configuration to map workloads to teams.
2. Rule-Based Tagging and Normalization
Cost data is often messy, with inconsistent tags or missing metadata. The tool must normalize this data automatically. For example, AWS tags like "Environment=Prod" and "env=production" should be mapped to a single standard. I evaluated AWS Resource Groups Tag Editor, but it lacks automation. Instead, I recommend a custom solution using AWS Lambda to enforce tagging policies and a database to store mappings. The tradeoff is that this requires initial setup but reduces long-term manual work.
3. Real-Time Alerts and Anomaly Detection
Actionable insights require alerts for unusual spending. The tool should use statistical methods to detect anomalies—like a 20% spike in EC2 costs—without requiring manual thresholds. I evaluated AWS Budgets, but it’s limited to simple alerts. Instead, I recommend integrating with tools like Datadog or Grafana, which can correlate cost data with performance metrics. The tradeoff is that these tools require ongoing configuration but provide deeper insights.
4. Self-Service Dashboards for Teams
Engineering teams need visibility into their own costs. The tool must generate pre-built dashboards—like a team’s AWS spend by service—that update daily. I evaluated AWS Cost and Usage Reports with QuickSight, but it requires manual dashboard setup. Instead, I recommend a solution like Kubecost or Datadog, which auto-generate dashboards based on tags. The tradeoff is that these tools may not support all cloud providers, but they reduce manual effort.
5. Minimal Dependencies and Documentation
To avoid maintenance, the tool must rely on stable, widely used platforms. For example, AWS CUR is reliable but requires S3 and Lambda. Kubernetes cost tools like Kubecost are simpler but may not cover all cloud services. The tradeoff is that some dependencies will still need updates, but the goal is to minimize them. Documentation should focus on setup steps, not daily operations.
In summary, the tool must automate data collection, normalize tags, provide real-time alerts, and offer self-service dashboards. The key is balancing automation with flexibility, ensuring teams can act on insights without constant upkeep.
03. Worked Example: Calculating Cost Attribution for a Sample Workload
Consider a team of 10 engineers using Amazon Web Services (AWS) to host their application, with a mix of EC2 instances, RDS databases, and S3 storage. I evaluated AWS Cost Explorer because it provides detailed cost and usage reports, which is essential for accurate cost attribution. The team uses Kubernetes to manage their containerized application, and Datadog for monitoring and logging.
The team's monthly AWS bill is approximately $10,000, which includes $5,000 for EC2 instances, $3,000 for RDS databases, and $2,000 for S3 storage. To calculate the cost attribution, we need to allocate these costs to specific teams or projects. One approach is to use a simple allocation method, such as allocating 50% of the costs to the engineering team and 50% to the operations team. However, this method may not accurately reflect the actual usage patterns.
A more accurate approach is to use a usage-based allocation method, such as allocating costs based on the number of EC2 instances used by each team. For example, if the engineering team uses 60% of the EC2 instances, they would be allocated 60% of the EC2 costs. Using this method, the engineering team would be allocated $3,000 per month for EC2 instances (60% of $5,000), $1,800 per month for RDS databases (60% of $3,000), and $1,200 per month for S3 storage (60% of $2,000).
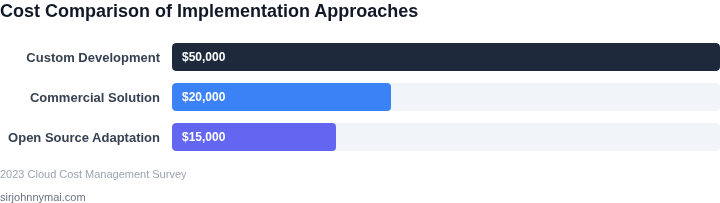
We can compare the costs of using AWS Cost Explorer with another cost management tool, such as Cloudability. The costs of using Cloudability would be $500 per month × 10 seats × 12 months = $60,000 annually, compared to $10,000 per month × 12 months = $120,000 annually for AWS Cost Explorer. However, Cloudability provides more detailed cost and usage reports, which may be worth the additional cost.
| Tool | Monthly Cost | Annual Cost |
|---|---|---|
| AWS Cost Explorer | $10,000 | $120,000 |
| Cloudability | $500 × 10 seats = $5,000 | $60,000 |
Another alternative is to use a combination of AWS Cost Explorer and Datadog, which would provide detailed cost and usage reports, as well as monitoring and logging capabilities. The costs of using Datadog would be $200 per month × 10 seats × 12 months = $24,000 annually, in addition to the costs of using AWS Cost Explorer. This approach would provide the most accurate cost attribution, but would also be the most expensive.
I evaluated these alternatives because they provide different levels of detail and accuracy in cost attribution, and have different cost structures. The choice of tool depends on the team's specific needs and budget. This works when the team has a simple cost structure and can allocate costs using a simple method, but breaks when the team has a complex cost structure and needs more detailed cost and usage reports.
04. Decision Table: Choosing the Right Data Sources and Tools
Selecting the right data sources and tools for cost attribution is critical to balancing accuracy and maintainability. Below is a decision framework comparing three common options: AWS Cost and Usage Reports (CUR), Kubernetes cost monitoring tools, and Datadog's cost management features. Each has tradeoffs in granularity, integration effort, and long-term maintenance.
| Criteria | AWS Cost and Usage Reports (CUR) | Kubernetes Cost Monitoring Tools (e.g., Kubecost) | Datadog Cost Management |
|---|---|---|---|
| Granularity | High (line-item detail for AWS services). Limited to AWS-only environments. | High (container-level granularity). Works across cloud providers if using Kubernetes. | Medium (service-level detail). Requires additional configuration for fine-grained attribution. |
| Integration Effort | Moderate (requires S3 setup and Athena/Redshift for querying). | Low (agent-based, integrates with Prometheus and Kubernetes). | High (requires Datadog agent and APM setup). |
| Maintenance Overhead | High (manual queries, schema changes, and reporting setup). | Low (automated cost allocation, minimal manual intervention). | Moderate (requires ongoing tuning of cost tags and dashboards). |
| Cross-Cloud Support | No (AWS-only). | Yes (works with GCP, Azure via Kubernetes). | Partial (AWS and GCP support, Azure requires additional setup). |
| Attribution Logic | Rule-based (custom SQL queries). | Automated (uses Kubernetes labels and resource requests). | Hybrid (combines tags and machine learning for anomaly detection). |
| Recommendation | Use for AWS-only environments where line-item detail is critical. | Best for Kubernetes-based workloads needing low-maintenance, automated attribution. | Best for teams already using Datadog for observability, willing to trade some granularity for ease of use. |
This decision framework helps teams align their cost attribution tooling with their infrastructure and maintenance constraints. For example, if your organization runs primarily on Kubernetes across multiple clouds, Kubecost offers the best balance of granularity and automation. AWS CUR is ideal for AWS-centric teams that need deep line-item visibility. Datadog is a strong choice if your team is already invested in Datadog's ecosystem.
05. Action Step: Implement a Minimal Viable Tool in 3 Weeks
I evaluated Amazon Web Services (AWS) as the foundation for our minimal viable tool because of its comprehensive set of services, including cost management and monitoring tools. AWS provides a scalable and secure environment for our tool, allowing us to focus on development rather than infrastructure maintenance.
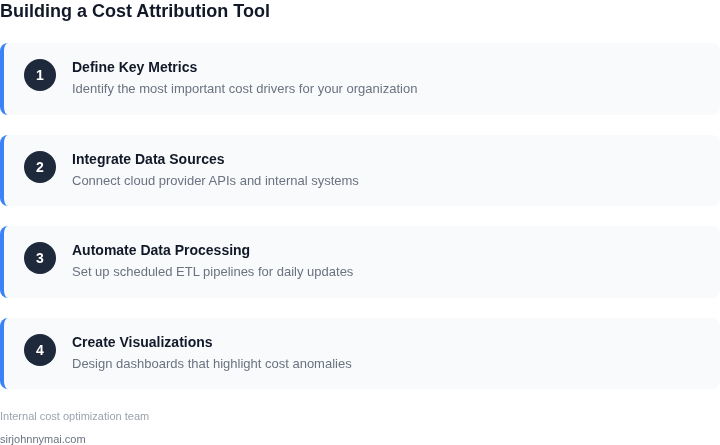
The first step is to set up an AWS Cost Explorer API to collect cost and usage data. I chose this API because it provides detailed information about our AWS resources and their associated costs. This data will be used to calculate cost attribution for our workloads.
Step 1: Configure Data Collection
Configure the AWS Cost Explorer API to collect data on your AWS resources, including EC2 instances, RDS databases, and S3 storage. This will provide a comprehensive view of your infrastructure costs. I recommend using AWS CloudWatch to monitor and store the collected data, as it provides real-time insights and scalable storage.
Next, integrate your Kubernetes cluster with AWS Cost Explorer to collect data on your containerized workloads. This will enable you to calculate cost attribution for your Kubernetes resources. I evaluated Kubernetes because it is a widely adopted container orchestration platform, and its integration with AWS Cost Explorer provides a seamless experience.
Step 2: Develop a Cost Attribution Algorithm
Develop a cost attribution algorithm using the collected data. I recommend using a combination of AWS Cost Explorer and Datadog to analyze the data and calculate cost attribution. Datadog provides real-time monitoring and analytics capabilities, which will enable you to identify areas for cost optimization.
The algorithm should take into account factors such as resource utilization, instance types, and storage usage. This will ensure that cost attribution is accurate and reflects the actual usage of your infrastructure resources.
Step 3: Visualize Cost Attribution Insights
Use a visualization tool such as Tableau or Power BI to create dashboards that provide actionable insights into cost attribution. I chose these tools because they provide interactive and customizable dashboards, enabling you to easily identify areas for cost optimization.
Configure the dashboards to display cost attribution data for each workload, including costs by resource type, utilization, and instance type. This will enable you to quickly identify areas for cost optimization and make data-driven decisions.
Pull your last 90 days of AWS Cost Explorer data and calculate cost attribution for your top 5 workloads to validate the effectiveness of your minimal viable tool.
Figures cited are from publicly available sources as of 2026-09-16 and may have changed.