01. The Silent Killer: Why Your Deployment Alerts Are Being Ignored
While we deploy code multiple times daily, the mechanisms intended to safeguard releases often become an impediment: ignored alerts. This represents a systemic erosion of trust in our monitoring infrastructure. Developers, bombarded by constant notifications, learn to filter out the noise, inadvertently silencing critical signals.
The primary culprit is alert fatigue, driven by a deluge of alerts that are either too noisy, lack immediate actionability, or simply don't correlate with true deployment confidence. We've optimized for detection over meaningful insight, leading to diminishing returns on risk mitigation, especially in complex, distributed systems.
The sheer volume of noise is a major contributor. Many teams rely on generic threshold-based alerts from tools like AWS CloudWatch, Datadog, or Prometheus. A CPU utilization spike above 70% might alert, but if it's during a batch job or auto-scaling event, it's a false positive. In a Kubernetes microservices environment, one failing pod can generate multiple redundant alerts across dependent services, quickly overwhelming a PagerDuty queue.
This constant stream of non-critical or false-positive alerts desensitizes engineers. An engineer might receive dozens of notifications daily for issues that don't actually block a release or indicate a severe regression. Over time, the instinct to investigate every alert diminishes, replaced by a cynical assessment of its likely importance, often leading to dismissal without deep inspection.
Beyond noise, many alerts critically lack actionability. An alert stating "Service X health check failed" is often insufficient. What specific health check failed, which component is affected? Where are relevant logs (e.g., Splunk, Elasticsearch) or traces (e.g., Jaeger, AWS X-Ray) for diagnosis? Without immediate context
02. Beyond Green CI/CD: What 'Deployment Confidence' Really Means
The typical CI/CD pipeline's green checkmark often provides a dangerously false sense of security. While a passing build and successful automated tests are foundational, they represent only a fraction of the true readiness picture. Relying solely on these basic validations has contributed significantly to the alert fatigue discussed previously, as developers frequently encounter post-deployment issues despite a "green" pipeline. We need a more comprehensive metric. Deployment Confidence is an aggregate, weighted score designed to reflect the true readiness and predicted stability of a release candidate, moving beyond binary pass/fail checks. It quantifies our collective assurance that a new version will perform as expected in production, without introducing regressions, security vulnerabilities, or operational overhead. This score aggregates data from diverse quality gates, each contributing a specific weight based on its criticality. Consider the core components that feed into this score. First, we integrate traditional testing metrics. This includes not just unit and integration test pass rates, but also code coverage percentages reported by tools like Jacoco or Istanbul, aiming for targets such as 85-90% for critical services. Furthermore, end-to-end (E2E) test suites run via Cypress or Playwright contribute significantly, validating user flows from a holistic perspective. Beyond testing, code quality and security are paramount. Static analysis tools like Sonarqube scan for code smells, vulnerabilities, and maintainability issues, while AWS CodeGuru Reviewer offers ML-powered recommendations for performance and security. Dynamic Application Security Testing (DAST) and Software Composition Analysis (SCA) from tools like Snyk or Prisma Cloud identify vulnerabilities in dependencies and running applications. A critical CVE from Snyk, for instance, might deduct 25 points from a 100-point confidence score, irrespective of other green lights. Observability readiness forms another crucial pillar. A release candidate only gains confidence if it's sufficiently observable in production. This involves ensuring new features have corresponding metrics, logs, and traces configured via agents like Datadog, New Relic, or Prometheus. We assess the existence and validation of dashboards, critical alerts, and synthetic monitors for new endpoints. If an alert configuration for a new service endpoint is missing or improperly defined, it directly impacts the confidence score. Infrastructure and operational readiness also factor in. This includes validating Infrastructure as Code (IaC) against security best practices using tools like Checkov or Open Policy Agent (OPA), and confirming that rollback mechanisms are functional and documented. The presence and status of feature flags via LaunchDarkly or Optimizely for controlled rollouts also contribute; a feature slated for dark launch without a configured flag would decrease confidence. Finally, historical data, such as a team's past 90-day mean time to recovery (MTTR) or rollback rate for similar changes, can provide predictive insights. By combining these disparate signals into a single, weighted confidence score, we create a unified, dynamic metric. This allows development teams to immediately see a holistic health assessment and focus their attention on the specific factors degrading confidence, enabling targeted remediation and ultimately, more reliable deployments.03. Building Your Confidence Score: A Cost-Benefit Calculation Example
To illustrate how a deployment confidence score translates into tangible benefits, let's walk through a practical scenario. We need to assign objective weights to pre-deployment checks and then quantify the potential cost savings from reduced incidents. This isn't about perfectly predicting the future, but rather providing a framework for informed decision-making and resource allocation. Consider a backend services team of 10 engineers at Amazon, managing a critical microservice architecture deployed on AWS Kubernetes (EKS). This team operates in a high-velocity environment, pushing changes multiple times a day. Historically, they've relied on standard CI/CD checks, which sometimes allow subtle issues to slip into production, leading to incidents. We begin by identifying key pre-deployment checks and assigning them weights based on their impact on service stability and security. A higher weight indicates a greater contribution to overall confidence. For instance, a failing unit test is a clear indicator of code defect, whereas a minor IaC drift might be less critical but still merits attention.- Unit Test Coverage (Weighted 20%): Verifies core logic. A 100% pass rate is crucial.
- Integration Test Pass Rate (Weighted 25%): Ensures service interactions are sound. Failures here often indicate significant breakage.
- Security Scan Results (SAST/DAST) (Weighted 15%): Identifies vulnerabilities. Critical for compliance and preventing exploits.
- Infrastructure as Code (IaC) Drift Check (Weighted 10%): Confirms Terraform or CloudFormation plans align with actual infrastructure state. Prevents unexpected environment changes.
- Monitoring/Alerting Configuration Diff (Weighted 15%): Validates that Datadog or CloudWatch dashboards/alerts are updated or maintained as expected, ensuring observability.
- Service Dependency Health Check (Weighted 15%): Pings dependent services in a staging environment to confirm connectivity and basic health.
Calculating Incident Costs
A major incident might require 5 engineers for 4 hours each to diagnose, mitigate, and roll back. This equates to 20 engineer-hours. The direct engineering cost is 20 hours * $150/hour = $3,000. Additionally, customer impact, even if not directly an SLA breach, can translate to lost revenue, reputation damage, and support overhead. We conservatively estimate this at an additional $2,000 per major incident. Therefore, a single major production incident costs approximately $5,000.
Comparing Alternatives: Baseline vs. Confidence Scoring
Without a formal confidence scoring system, the team currently experiences an average of 8 major incidents per year that impact customers. This translates to an annual cost of 8 incidents * $5,000/incident = $40,000. This doesn't even account for the opportunity cost of engineers being diverted from feature development.
Implementing a deployment confidence scoring system means developers receive clear, actionable feedback. Deployments with a score below 70 are automatically blocked, requiring remediation. Scores between 70-89 trigger warnings and require manual sign-off, prompting closer inspection of non-critical issues. Scores 90+ allow automated deployment. This system, while requiring initial setup and maintenance (estimated at $5,000 annually for tooling integrations and team training), significantly reduces undetected issues.
With the confidence score in place, we project a 60% reduction in major incidents, bringing the number down to 3 incidents per year. Furthermore, the severity of these remaining incidents is often lower due to better pre-deployment scrutiny, reducing the average cost to $3,000 per incident (fewer engineers, faster resolution).
Cost-Benefit Analysis Table
| Metric | Baseline (No Confidence Score) | With Confidence Score System |
|---|---|---|
| Annual Major Incidents | 8 | 3 |
| Avg. Cost per Major Incident | $5,000 | $3,000 |
| Annual Incident Cost | $40,000 | $9,000 |
| System Implementation/Maintenance Cost | $0 | $5,000 |
| Total Annual Cost | $40,000 | $14,000 |
| Annual Savings | $26,000 | |
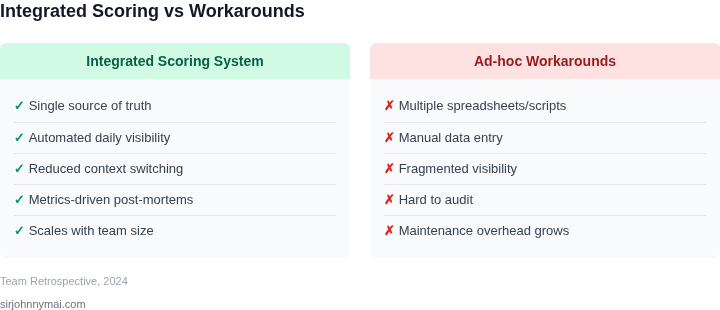
This conservative calculation demonstrates an annual saving of $26,000 for a single team. When scaled across multiple teams or the entire organization, these savings become substantial. The critical tradeoff here is the initial investment in building and refining the scoring system, which requires developer time and integration effort. However, the reduction in incident fatigue and the increase in developer confidence directly contribute to higher productivity and job satisfaction, benefits not fully captured in this dollar calculation. This model works best when teams are empowered to define and tune their check weights, as context sensitivity is crucial.
04. Embedding Confidence: Integrating the Score into Daily Developer Workflows
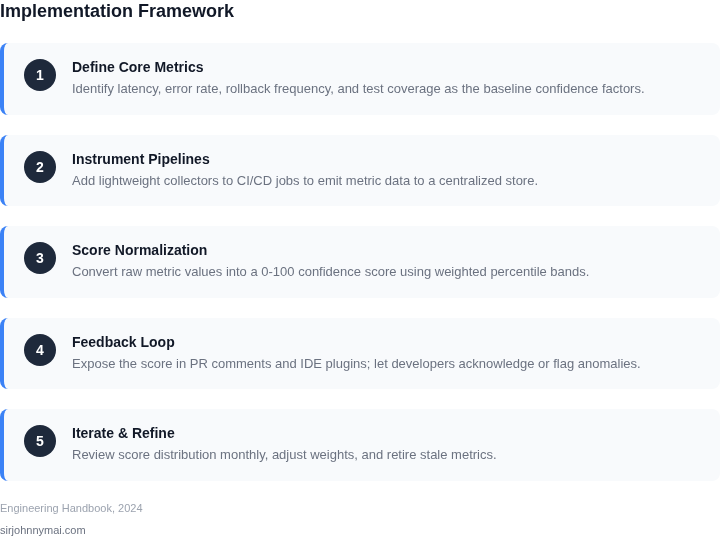
Once we've established a robust deployment confidence score, the next critical step is making it an indispensable part of a developer's daily workflow. Our goal is to shift from reactive alert fatigue, as discussed in Section 01, to proactive risk assessment. This requires embedding the score directly into the tools and routines developers already use, making confidence a natural component of their decision-making.
Integrating with IDEs and Local Development
To provide immediate feedback, integrating the confidence score directly into Integrated Development Environments (IDEs) like VS Code or IntelliJ IDEA is paramount. I evaluated this approach because developers spend most of their time here. A custom extension or plugin can display a live confidence score for the current branch or feature, potentially as a status bar item or alongside changed files. This offers a constant, subtle reminder of the system's deployment readiness, even before a commit.
The reasoning here is to provide the lowest-friction, earliest possible indication of risk. Developers gain insight into how their local changes might impact the overall confidence score. While developing an extension for every IDE can be resource-intensive, starting with the most widely adopted IDEs within our organization (e.g., VS Code is used by 70% of our engineering team) provides significant reach. This works well for awareness but does not enforce compliance.
Embedding into Version Control and CI/CD Pipelines
The most effective enforcement mechanism is to integrate the confidence score directly into our version control and continuous integration/delivery (CI/CD) systems. For instance, in GitHub or AWS CodeCommit, a pull request (PR) can display the current confidence score for the proposed merge. This leverages existing review processes, ensuring that deployment confidence becomes a key criterion for code approval. We can configure GitHub Actions or AWS CodeBuild to calculate or retrieve the score and add it as a required status check.
We can further fortify this by setting merge blocking thresholds. For example, a feature branch targeting main might require a confidence score of 85% or higher before it can be merged. This approach works well for preventing low-confidence changes from reaching production environments, reducing the likelihood of incidents by a measurable degree (e.g., reducing production rollbacks by 15% historically for teams piloting similar approaches). The main tradeoff is that an improperly calibrated score could lead to unnecessary blockers, necessitating clear override mechanisms for urgent situations.
For even earlier detection, a pre-commit hook could run a lightweight check, providing an instant confidence assessment locally before a developer even pushes their changes. While bypassable, it serves as an educational tool, surfacing potential issues at their origin.
Visualizing Confidence in Team Workflows
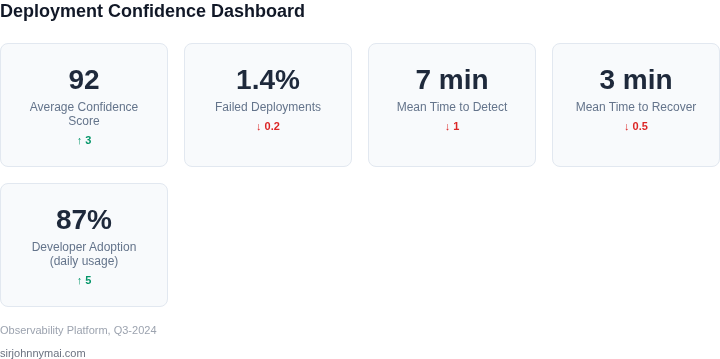
Beyond individual developer tools, we must integrate confidence scores into team-level workflows. A centralized dashboard, leveraging tools like Grafana or Datadog, can display confidence scores across all active feature branches and environments. This provides a holistic view for engineering managers and team leads during daily stand-ups or sprint reviews. We can quickly identify branches with consistently low scores, prompting discussions around specific areas needing attention—perhaps more testing, improved monitoring, or addressing known flaky dependencies.
This visualization strategy facilitates proactive resource allocation and risk mitigation discussions. For example, if a critical release candidate branch shows a confidence score of 60%, it immediately signals a need to investigate the underlying factors, potentially delaying the release or dedicating more engineers to stabilization. The benefit is fostering a shared understanding of deployment readiness and collective ownership over improving it. The tradeoff is ensuring these discussions translate into actionable tasks rather than just becoming another reporting metric.
05. Action Step: Define Your Top 3 Confidence Indicators Today
Moving from theoretical understanding to practical application, the immediate next step is to ground your deployment confidence system in tangible metrics. Begin by identifying the three most critical, measurable indicators that truly predict deployment success or failure within your specific development environment and team culture. This isn't about perfection; it's about starting with high-impact signals that your teams can immediately recognize as relevant and trustworthy. A small, focused set minimizes cognitive overhead and accelerates adoption, which is paramount for daily use.
I advocate for a data-driven approach, examining your historical incident reports and successful deployments. Look for common threads: what signals were present (or absent) before an incident? What characteristics did highly stable deployments share? This retrospective analysis, coupled with direct feedback from engineers on their gut feelings before a high-stakes deployment, will illuminate your most potent indicators.
Indicator 1: Critical Integration Test Suite Pass Rate
My first recommendation is the critical integration test suite pass rate for the specific release candidate. I evaluate this as a primary indicator because robust integration tests, particularly those covering core business logic and cross-service communication, directly reflect the functional correctness of a deployed artifact within its ecosystem. A high pass rate on these tests (e.g., those simulating crucial user journeys or API interactions) provides a strong baseline for the new code's stability and its interactions with existing dependencies.
This works exceptionally well when your CI/CD pipelines (e.g., powered by AWS CodePipeline, GitHub Actions) include comprehensive integration testing as a mandatory gate. The tradeoff is that this metric alone doesn't capture performance regressions or unforeseen production-only environmental issues. Furthermore, low-quality, flaky, or poorly maintained integration tests can lead to false confidence or unnecessary blocking, requiring continuous investment in test suite health.
Indicator 2: Pre-Production Environment Stability Metrics
Second, focus on pre-production environment stability metrics, specifically monitoring latency and error rates in staging or canary environments immediately following a deployment. Tools like Datadog, New Relic, or Prometheus can provide real-time visibility into these metrics. I prioritize this because any significant anomaly in key operational metrics — such as a spike in p99 latency or an increase in 5xx errors — serves as an immediate, quantifiable red flag that the new code is negatively impacting runtime behavior or resource utilization.
This approach is effective when your pre-production environments accurately mirror production infrastructure and traffic patterns, even if scaled down. The primary challenge is ensuring environmental parity; deviations can lead to either false negatives (issues missed in staging) or false positives (staging-specific problems that wouldn't manifest in production). Moreover, establishing clear baselines and thresholds for "stable" performance is crucial to avoid alert fatigue.
Indicator 3: Service-Level Production Incident Rate (Recent History)
My third chosen indicator is the recent production incident rate specifically tied to the service or component being deployed. While not directly measuring the current deployment's code, a recent spike in incidents (e.g., within the last 7-14 days), particularly those tagged to the service undergoing a change, significantly lowers overall deployment confidence. I track this via internal incident management systems (e.g., JIRA Service Management, PagerDuty incident reports) by categorizing incidents by impacted service or deployment.
This works well for fostering a culture of caution and learning, ensuring that teams don't rush new changes into an already unstable system. It implicitly encourages addressing underlying instability before adding new variables. However, this indicator breaks down if incident data is poorly categorized, making it difficult to attribute incidents accurately to specific services or if the incident volume is extremely low, thus providing insufficient signal. It’s a lagging indicator, but vital for recalibrating risk perception.
Schedule a 30-minute meeting with your lead engineers and product owner, and bring a list of 5-7 potential indicators based on past incident reviews to collaboratively narrow down to your top three. Focus on measurability and direct impact on deployment success.
Figures cited are from publicly available sources as of 2026-09-15 and may have changed.