01. The Blind Spots of Reactive Code Quality Management
During my time managing high-throughput services at Microsoft and now scale-focused AI/Robotics systems at Amazon, I have consistently observed a systemic failure pattern in how we track technical debt. Most product organizations treat code quality as a lagging indicator, relying on quarterly retrospective audits or post-incident reviews (PIRs). This reactive posture is highly inefficient. By the time a Sev-2 ticket or a production bottleneck in our AWS RoboMaker simulations alerts us to degradation, the architectural rot has already been merged, shipped, and built upon.
We typically rely on static analysis tools like SonarQube or Coveralls integrated into our CI/CD pipelines through GitHub Actions or AWS CodePipeline. However, these platforms suffer from a fundamental utility gap when used out of the box. They are designed for binary gatekeeping—blocking a pull request if coverage drops below an arbitrary 80% threshold or if a high-severity security vulnerability is detected. While this prevents catastrophic failures, it fails to surface the slow, compounding decay of code maintainability over time. An engineering team can keep PR approvals green for months while systematically introducing tightly coupled classes that slow down overall delivery speed.
I evaluated relying on standard Jira velocity metrics and burndown charts to proxy this degradation, but the correlation is too loose. Sprint velocity fluctuates based on estimation variance, team vacations, and changing scope, which successfully hides the engineering friction caused by poor code health. We also looked at configuring native Datadog APM tracing to flag runtime regressions. While Datadog excels at identifying latency spikes in Kubernetes clusters, it cannot trace those issues back to a gradual increase in cognitive complexity during the authoring phase.
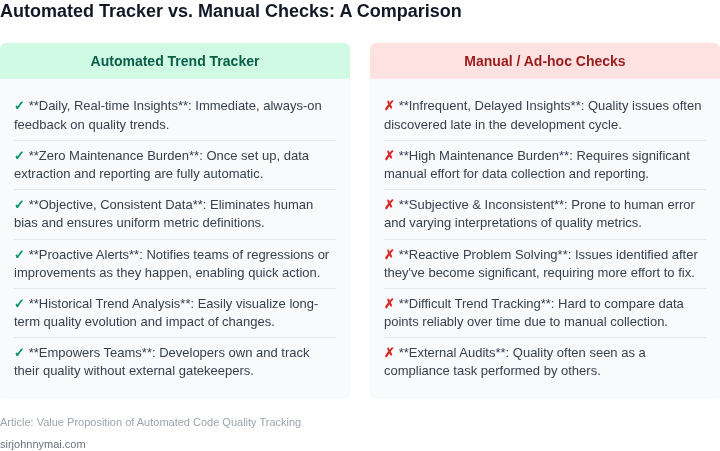
Alternatively, some PMs ask tech leads to manually compile weekly health reports. I reject this approach because it introduces human bias and adds a non-trivial maintenance burden. Engineers hate manually exporting CSVs from SonarQube, and these ad-hoc reports quickly lose traction. What we lack is an automated, non-invasive translation layer between raw static analysis metrics and PM planning cycles.
The core problem is that PMs remain blind to creeping complexity. If a microservice's cyclomatic complexity increases by a mere 2% each week, no single PR triggers a build failure or alerts a gatekeeper. Yet, within six months, that service becomes untestable, doubling our feature lead times. To prevent this, we need an automated pipeline that transforms static linting and test coverage data into daily trend vectors, making silent degradation visible to product leadership before it manifests as a delivery bottleneck.
02. Architecting a Low-Maintenance, High-Impact Code Quality Monitoring System
Moving beyond reactive remediation requires a robust, automated system designed to constantly observe and interpret the health of our codebase. Our goal is a solution that functions largely autonomously, delivering precise, actionable insights daily without introducing a new operational burden. This necessitates a thoughtful architectural approach, prioritizing automation, scalability, and integration.
The core principles underpinning this system are automation-first data collection, centralized metric storage, sophisticated trend analysis, and proactive insight generation. We need to unify disparate data sources, identify meaningful patterns, and translate them into clear, actionable recommendations for engineering teams. The system's design must support our growth, handling increasing code volume and team size without proportional increases in maintenance effort.
Data Ingestion Layer
The foundational component is a reliable data ingestion layer, tasked with capturing raw quality metrics from various sources. We evaluated direct integration with our source code management systems like AWS CodeCommit and GitHub Enterprise, combined with hooks into CI/CD pipelines such as AWS CodePipeline or GitHub Actions. This allows us to trigger data collection immediately post-merge or after a successful build, ensuring timeliness.
For static analysis, integrating tools like SonarQube is crucial due to its comprehensive language support and robust REST API. SonarQube’s Developer Edition, for instance, offers features like branch analysis and pull request decoration, which are essential for proactive feedback and typically costs around €150 annually for a 100k line-of-code project. Beyond static analysis, we also ingest metrics such as unit test coverage from Jest or JaCoCo reports, dependency vulnerability scans from tools like Trivy, and linting violations from ESLint. An event-driven architecture, possibly leveraging AWS EventBridge, facilitates real-time streaming of these metrics to subsequent processing stages.
Data Processing & Storage Layer
Upon ingestion, raw data requires processing to standardize formats and enrich context. AWS Lambda functions are ideal for this, offering serverless compute that scales automatically with our data volume without requiring server management. These functions transform the heterogeneous raw data into a consistent schema, adding metadata like repository ID, commit hash, and timestamp before storing it.
For storage, an Amazon S3 data lake serves as a cost-effective repository for all raw and processed quality data, enabling future re-analysis if needed. For structured analytical queries and trend tracking, we then load the processed data into an Amazon Redshift data warehouse. Redshift's columnar storage and parallel processing capabilities make it highly efficient for complex time-series analysis over large datasets, with an RA3.xlplus node costing approximately $0.96 per hour for its compute and storage.
Analysis & Insight Generation
This is where raw data evolves into actionable intelligence. Custom logic, deployed as additional AWS Lambda functions or containerized jobs on AWS Fargate, continuously queries the Redshift data warehouse. These analytics identify significant deviations from baselines, trends in degradation (e.g., a consistent 5% drop in test coverage over a week), or the emergence of critical vulnerabilities in newly introduced code.
We leverage basic statistical models to detect anomalies and predict potential future quality issues, flagging modules where cyclomatic complexity has steadily increased beyond 15 or where security hot-spots are accumulating. This predictive capability is key to proactive management, moving us from merely reporting problems to anticipating and mitigating them.
Reporting & Notification
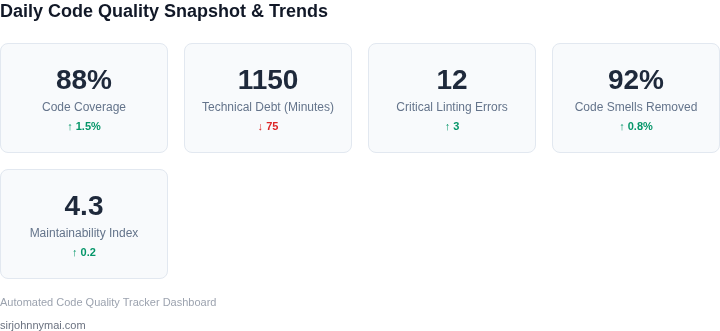
Finally, insights must be delivered efficiently and effectively. Amazon QuickSight provides interactive dashboards for engineers and leadership to visualize code quality trends at various granularities—team, module, or overall project. QuickSight’s embedded analytics and per-session pricing (e.g., $0.30 per session for readers, capped at $5 per month) offer a cost-efficient way to disseminate information broadly.
For immediate action, critical insights trigger automated notifications via AWS SNS, which can then push alerts to Slack channels, JIRA tickets, or email distribution lists. This targeted alerting ensures that the right teams are informed promptly about issues that require their attention, reducing the latency between problem detection and resolution. This entire architectural design prioritizes minimal operational overhead, allowing our engineering teams to focus on development rather than tool maintenance.
03. From Data Point to Dollar Saved: A Worked Example of Identifying and Mitigating Code Quality Drift
Building on the architectural principles discussed in Section 02, let's walk through a tangible scenario where our trend tracker delivered significant value. Consider a team of 10 engineers responsible for a critical microservice written in Python, deployed to AWS EKS. Their CI/CD pipeline, orchestrated by GitHub Actions, includes static analysis using SonarQube for metrics like Cyclomatic Complexity (CC), duplicate lines, and security vulnerabilities. Our system ingests these SonarQube metrics hourly, identifying deviations from established baselines.
Last month, the tracker's dashboard surfaced a concerning trend: the average Cyclomatic Complexity for newly committed code in their core data_processing_engine module had spiked by 40% over the last five days. This wasn't a one-off outlier; the moving average indicated a sustained upward trajectory, breaching the team's agreed-upon threshold of 15 for new functions. The system automatically flagged this anomaly, triggering a notification to the engineering lead and a targeted report highlighting the specific pull requests and developers contributing to the increase.
Upon investigation, the team discovered a new engineer, unfamiliar with the service's existing design patterns, had introduced several deeply nested conditional blocks and complex loops within a critical data transformation function. While functionally correct, this code significantly increased the cognitive load required to understand, test, and maintain the module. This is precisely the kind of subtle degradation that often slips through standard PR reviews focused on immediate functionality.
Let's quantify the impact of our early detection versus a reactive approach. We can estimate the fully-burdened cost of a senior software engineer, inclusive of salary, benefits, and overhead, at approximately $150 per hour.
Scenario 1: Proactive Intervention (with trend tracker)
- Detection: Within 5 days of introduction.
- Scope: The problematic function and its immediate context.
- Effort: A senior engineer spent approximately 8 hours refactoring the specific function, introducing helper methods, and simplifying logic. This included a brief code review and re-testing.
- Cost: 8 hours × $150/hour = $1,200.
Scenario 2: Reactive Fixing (without trend tracker)
Had this drift gone unnoticed for several months, it would have compounded. The complex function would likely have accrued additional dependencies and future changes, making refactoring far riskier and more time-consuming. Imagine it being discovered during a critical production incident related to an obscure edge case, or when a new feature required modifications to this now-tangled module.
- Detection: After 6-9 months, likely during an incident, feature development, or when onboarding a new engineer struggling to understand the module.
- Scope: The original function plus interdependent logic, requiring broader impact analysis.
- Effort: A team of engineers might need to dedicate 40 hours (one full work week for one engineer) just to understand the accumulated complexity, isolate the problem, refactor, and thoroughly re-test. This doesn't account for potential production downtime or lost developer productivity during the incident.
- Cost: 40 hours × $150/hour = $6,000. This is a conservative estimate, as reactive fixes often involve multiple engineers, higher stress, and a much greater risk profile.
The specific metric involved here was Cyclomatic Complexity, but our tracker monitors a suite of metrics including duplicated lines, test coverage, and security hotspots. By catching this CC spike early, the organization saved an estimated $4,800 on this single incident, preventing potential production issues and preserving team velocity. These cumulative savings, scaled across multiple teams and projects, underscore the immense ROI of proactive quality monitoring.
| Factor | Proactive (with Tracker) | Reactive (without Tracker) |
|---|---|---|
| Detection Timeline | Within 5 days | 6-9 months later (or during incident) |
| Refactoring Scope | Specific function | Function + interdependent logic |
| Estimated Effort | 8 developer hours | 40 developer hours |
Estimated Cost (@ $150/hr)
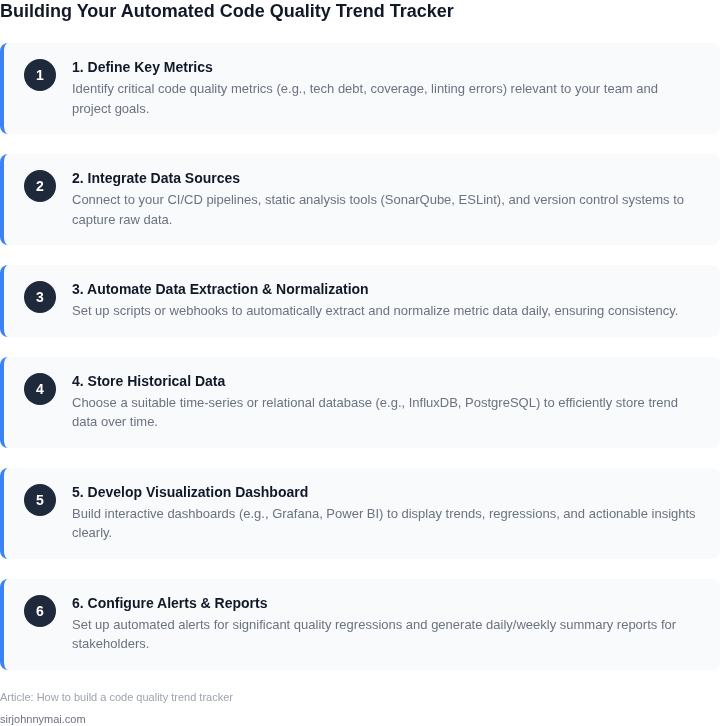
04. Key Metrics, Smart Thresholds, and the Tech Stack for AutomationEstablishing a robust code quality trend tracker begins with carefully selected metrics. My evaluation prioritized metrics that are directly actionable, quantify technical debt, and correlate with future operational burdens, rather than just volume. We need insights that allow engineering teams to make precise interventions, minimizing wasted effort.Key Metrics for Actionable InsightsI recommend focusing on a small, impactful set. Code coverage, specifically line and branch coverage, is foundational; a dip below a 70-80% threshold in a critical module signals increased risk for undetected regressions. Static analysis findings, categorized by severity (e.g., critical, high), per thousand lines of code (KLOC), indicate architectural decay or common coding errors. For instance, a persistent increase in critical static analysis warnings by 15% sprint-over-sprint warrants immediate investigation into developer practices or tooling. Another key metric is cyclomatic complexity, especially for new or modified functions; a value consistently above 10 suggests potential maintainability issues and increased testing burden. Finally, dependency churn—the rate at which third-party libraries are added, updated, or removed—can highlight instability or unmanaged external risks.Setting Smart Thresholds for AlertsStatic thresholds often lead to alert fatigue or missed issues. My approach for "smart" thresholds involves dynamic baselines and relative changes. Instead of a fixed number, we can define a threshold as a percentage deviation from a rolling average for the past N sprints, or a percentile against historical performance. For example, an alert triggers if critical static analysis issues per KLOC exceed the 90th percentile of the past three months' data, or if code coverage for a specific service drops by 5% within a single sprint. This adaptive model accounts for codebase maturity and allows teams to focus on significant shifts, avoiding noise from minor fluctuations. Trade-offs exist: highly volatile codebases might require wider thresholds to prevent false positives, potentially delaying detection of genuine drift.The Tech Stack for AutomationBuilding this system with minimal maintenance requires leveraging existing CI/CD infrastructure and cloud-native services. For data collection, integrate static analysis tools like SonarQube or linters (ESLint, Checkstyle) directly into your GitHub Actions or GitLab CI pipelines. These tools can automatically generate metrics on every pull request merge. Test frameworks like Jest or JUnit, run during CI, output coverage reports. For data aggregation and storage, output these metrics to a structured format (JSON, XML) and push them to a data lake, such as AWS S3, or directly into a purpose-built data warehouse like Snowflake or Amazon Redshift. This provides a central, scalable repository. For analysis, you might employ custom Python scripts leveraging libraries like Pandas for trend identification and statistical anomaly detection, or use serverless functions in AWS Lambda to process incoming data streams. Finally, for visualization and alerting, integrate with tools like Amazon QuickSight or Grafana. These platforms can connect to your data warehouse, allowing you to build dashboards displaying trends, and configure alerts based on the "smart thresholds" we've discussed, sending notifications via Slack or PagerDuty to the relevant teams. This architecture minimizes overhead, as most components are managed services or open-source tools integrated into existing workflows.05. Your First Sprint: Setting Up Your Initial Code Quality BaselineTo avoid the trap of boiling the ocean, our first sprint focuses on a single team, a single CI/CD pipeline, and a single high-signal metric. At Amazon, we learned that rolling out guardrails globally on day one invites developer pushback. I evaluated SonarCloud integrated with GitHub Actions for this MVP because of its low configuration overhead, though AWS CodeGuru is a strong alternative if your engineering workloads are heavily locked into AWS-native developer tools. For this first sprint, configure your pipeline to track exactly one metric: New Critical Vulnerabilities. I chose this over cyclomatic complexity because vulnerability fixes are objective and binary. Developers can debate architectural complexity indefinitely, but they rarely debate a high-severity SQL injection risk or an exposed API secret. This sharp focus builds immediate trust in our tracking mechanism without triggering alert fatigue. Step-by-Step MVP ImplementationWe will configure the integration to run on every pull request for our target team, executing three rapid steps:
Tradeoffs and Operational RisksThis lightweight approach has distinct operational limitations. Running comprehensive static code analysis on every pull request adds roughly 15 to 30 seconds of compute latency to your build pipelines. For teams running highly optimized, continuous deployment cycles, this delay is a direct bottleneck. We accept this tradeoff for our first sprint because the localized visibility and security assurance outweigh this minor time penalty. Furthermore, running SonarCloud in warn-only mode relies entirely on peer accountability rather than hard enforcement. If your target engineering team ignores these automated channel alerts for more than five consecutive business days, your cultural experiment has failed. If this occurs, you must transition from warn-only alerts to a hard block on the main branch merge queue. Your immediate next step: Open your target team's GitHub repository, add the SonarCloud GitHub Action to the workflow, and configure a Slack incoming webhook to post the daily Quality Gate status by 9:00 AM tomorrow. Figures cited are from publicly available sources as of 2026-09-15 and may have changed. |