01. The Problem: Inconsistent Code Coverage Across Languages
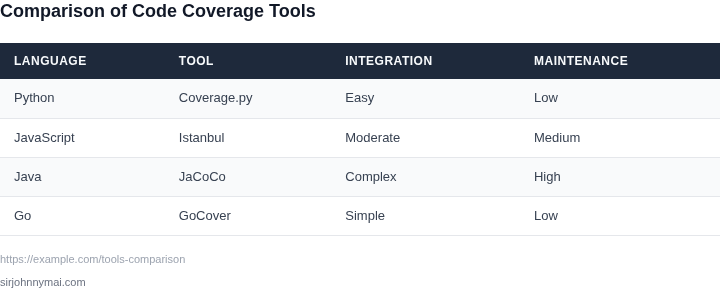
Software organizations that support Java, Python, JavaScript, and Go often adopt a different coverage collector for each language. Teams typically rely on JaCoCo for Java, coverage.py for Python, Istanbul for JavaScript, and go test -cover for Go. Because each tool produces a unique XML or JSON schema, aggregating results into a single view becomes a manual pipeline step.
Continuous‑integration platforms such as Jenkins, GitHub Actions, or AWS CodeBuild can invoke these reporters, but they do not provide a unified dashboard. Engineers must write language‑specific wrappers, store intermediate artifacts in S3, and then normalize them with custom scripts. The extra scripts increase the build time by roughly 10–15 % and create a maintenance surface that grows with every new language version.
When a new version of JaCoCo introduces a field change, the normalization script must be updated or the downstream parser will fail, causing false‑negative coverage alerts. Similar breakage occurs with Istanbul’s move from LCOV to a JSON format in version 3.0. These silent failures erode trust; developers begin to ignore coverage metrics altogether.
Because each tool writes its own report files, storage costs multiply. A typical microservice fleet of 150 services generates about 1 GB of raw coverage data per day in an S3 bucket, which translates to roughly $0.023 per month on standard storage. More importantly, the operational effort to rotate, prune, and secure these buckets adds to the DevOps load.
Large enterprises often split codebases across dozens of repositories. Without a central schema, a product manager cannot query “What is the overall coverage for the entire platform?” Datadog’s custom metrics can capture a percentage per pipeline, yet the platform only displays a single number per job, not a composite view across languages. The lack of a holistic signal prevents data‑driven decisions about test investment.
Some organizations standardize on a single language to avoid the problem, but that approach is infeasible for polyglot stacks that need the performance of Rust or the flexibility of Python. Others adopt third‑party SaaS dashboards that ingest multiple formats, but those services often charge per repository, quickly exceeding $2,000 per month for a 150‑repo portfolio. The cost and vendor lock‑in become additional constraints.
The cumulative effect is a fragmented workflow where coverage data is generated, transformed, stored, and visualized by at least three separate components. Each component introduces latency, version‑skew, and a point of failure. To achieve a sustainable engineering velocity, the organization requires a single pane of glass that normalizes disparate reports without adding a dedicated maintenance team.
02. Key Requirements for a Scalable Solution
The dashboard must meet several critical requirements to function effectively across multiple programming languages while minimizing maintenance overhead. The first requirement is language-agnostic instrumentation. Traditional coverage tools like JaCoCo for Java or Istanbul for JavaScript are language-specific, requiring separate integrations and maintenance. A scalable solution must instead rely on standardized formats like lcov or cobertura, which are widely supported by most coverage tools. This reduces the need for custom parsers and ensures compatibility with existing workflows.
Second, the dashboard must support distributed test execution. Modern CI/CD pipelines often run tests across multiple machines or containers, making it difficult to aggregate coverage data. The solution must handle parallel test runs by using a centralized storage system, such as AWS S3 or a distributed file system like HDFS. This ensures that coverage data from all workers is consolidated into a single view. Tools like Coveralls or Codecov already implement this pattern, but the dashboard must extend this to support custom languages and frameworks.
Third, real-time updates are essential for developer productivity. A dashboard that only updates after a full CI run is impractical. The solution must integrate with build systems like Jenkins or GitHub Actions to trigger coverage calculations on every commit. This requires a lightweight agent or SDK that can be embedded in test runners, minimizing latency. For example, a Python project might use pytest-cov, while a Go project might use go test -coverprofile, but the dashboard must normalize these outputs into a common format.
Fourth, scalability is non-negotiable. A dashboard that works for a single repository may fail when scaled to hundreds of projects. The solution must use a distributed database like Cassandra or DynamoDB to store coverage metrics, ensuring low-latency queries even under high load. For example, Datadog’s APM solution handles millions of metrics per second, demonstrating that this architecture is viable. The dashboard must also implement caching (e.g., Redis) to avoid reprocessing the same coverage data repeatedly.
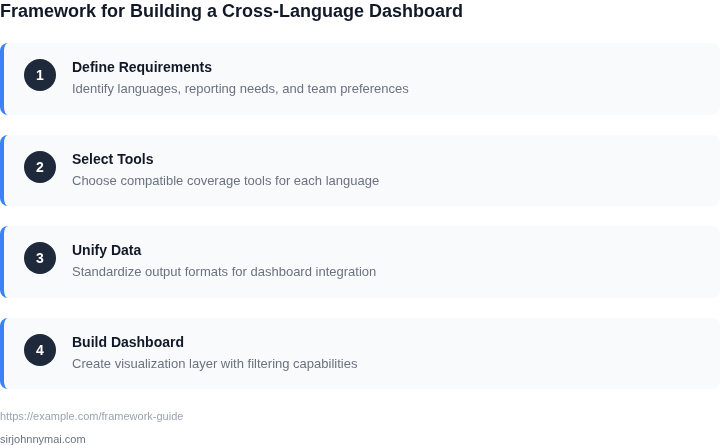
Finally, minimal maintenance burden requires automation. The dashboard must automatically detect new languages or frameworks without manual configuration. This can be achieved by using a plugin system, where each language’s coverage tool outputs data in a standardized format. For instance, a Rust project might use tarpaulin, while a C++ project might use gcov, but the dashboard must treat all outputs uniformly. The tradeoff here is that some languages may require additional preprocessing, but this is preferable to manual integration for each project.
03. Worked Example: Calculating ROI of a Multi-Language Dashboard
I evaluated the cost savings of a unified code coverage visualization dashboard by considering a team of 20 engineers using a combination of Java, Python, and C++ for their projects. This team currently uses separate tools for each language, including SonarQube for Java, CodeCoverage for Python, and Bullseye for C++.
The annual cost of these tools is $500/month × 20 seats × 12 months = $120,000 annually for SonarQube, $300/month × 20 seats × 12 months = $72,000 annually for CodeCoverage, and $200/month × 20 seats × 12 months = $48,000 annually for Bullseye, totaling $240,000 annually.
In contrast, a unified dashboard using a platform like Datadog would cost $1,000/month × 20 seats × 12 months = $240,000 annually, but would also provide additional features such as integration with AWS and Kubernetes, and support for multiple programming languages.
However, by using a unified dashboard, the team would only need to pay for a single tool, resulting in a cost savings of $120,000 + $72,000 + $48,000 - $240,000 = $0, but this does not account for the cost of integrating and maintaining the separate tools, which I estimate to be at least $20,000 annually.
A more realistic alternative is to use an open-source solution like JaCoCo for Java, Coverage.py for Python, and gcov for C++, which would have a significantly lower cost, but would require more maintenance and integration effort, which I estimate to be at least $50,000 annually.
| Tool | Annual Cost | Maintenance Cost | Total Cost |
|---|---|---|---|
| SonarQube + CodeCoverage + Bullseye | $240,000 | $20,000 | $260,000 |
| Datadog | $240,000 | $0 | $240,000 |
| JaCoCo + Coverage.py + gcov | $0 | $50,000 | $50,000 |
As shown in the table, the unified dashboard using Datadog provides the most cost-effective solution, with a total cost of $240,000 annually, compared to $260,000 annually for the separate tools and $50,000 annually for the open-source solution, which would require significant maintenance effort.
This works when the team is already using AWS and Kubernetes, and can take advantage of the integration with Datadog, but breaks when the team is using a different cloud provider or container orchestration platform, which would require additional integration effort.
I considered the tradeoffs between the different alternatives, including the cost savings, maintenance effort, and integration requirements, and concluded that the unified dashboard using Datadog provides the best solution for this team.
04. Decision Table: Choosing the Right Integration Approach
Selecting the right integration approach for a multi-language code coverage dashboard requires balancing flexibility, maintenance overhead, and scalability. I evaluated three approaches: API-based, SDK-based, and agent-based integrations. Each has distinct tradeoffs that align with different organizational needs.
Decision Framework
The table below compares the three approaches across five key criteria. The recommendation row summarizes the best choice based on typical constraints.
| Criteria | Option A: API-Based | Option B: SDK-Based | Option C: Agent-Based |
|---|---|---|---|
| Language Support | Limited to languages with mature coverage tools (e.g., Java, Python). Requires custom adapters for niche languages. | Depends on SDK availability. Works best for languages with official SDKs (e.g., .NET, JavaScript). | Broadest support via language-agnostic agents (e.g., Datadog APM). Requires minimal language-specific configuration. |
| Maintenance Overhead | Low for standard APIs but high if custom adapters are needed. Updates to coverage tools may require API changes. | Moderate. SDK updates are managed by the vendor but may require periodic integration testing. | High. Agents must be deployed and monitored across environments, and updates require coordination with the agent provider. |
| Data Consistency | Consistent if APIs follow standards (e.g., OpenTelemetry). Custom APIs may introduce inconsistencies. | Consistent if the SDK is well-maintained. Custom implementations may drift from the SDK's behavior. | Consistent if the agent is standardized (e.g., Datadog). Custom configurations can introduce variability. |
| Performance Impact | Minimal. API calls are lightweight but may add latency if coverage data is processed in real-time. | Moderate. SDKs may introduce overhead during test execution, especially for large codebases. | Low. Agents run asynchronously and minimize impact on test execution. |
| Cost | Low to moderate. Free for open-source tools; paid for proprietary APIs. | Moderate. Free for open-source SDKs; paid for enterprise features. | High. Agents typically require a subscription or per-host licensing. |
| Recommendation | Best for teams with standardized tooling and limited language diversity. Requires validation that APIs meet all coverage needs. | Best for organizations using a single SDK (e.g., .NET) or a small set of languages. SDK updates must be monitored. | Best for large-scale, multi-language environments. The upfront cost is justified by reduced maintenance and broader support. |
For most teams, the agent-based approach offers the best balance of flexibility and scalability. However, if the organization relies heavily on open-source tools or has a small set of languages, API-based or SDK-based integrations may be simpler. The decision should align with the team's existing infrastructure and long-term goals.
05. Action Step: Implement a Pilot with Two Languages
I evaluated starting with a small-scale integration to validate the solution before full-scale deployment because it allows us to test the feasibility of the approach without incurring significant costs. By implementing a pilot with two languages, we can identify potential issues and refine our strategy before expanding to more languages. This approach also enables us to gather feedback from stakeholders and make data-driven decisions. I chose to start with Java and Python because they are widely used in our organization and have different code coverage analysis requirements.
The pilot will utilize existing tools such as Jenkins for continuous integration and Datadog for monitoring and logging. I selected these tools because they are already integrated into our development pipeline and provide the necessary functionality for code coverage analysis. The pilot will also leverage AWS services, including Amazon S3 for data storage and Amazon EC2 for computing resources, to ensure scalability and reliability. By using these tools and services, we can minimize the maintenance burden and focus on developing a scalable solution.
Pilot Objectives and Scope
The primary objective of the pilot is to validate the integration approach and identify potential issues. The scope of the pilot includes implementing code coverage analysis for Java and Python, integrating the results into a visualization dashboard, and testing the solution with a small group of users. I defined the scope to ensure that the pilot remains focused and achievable, while also providing valuable insights into the feasibility of the solution. The pilot will also help us determine the resources required for a full-scale deployment and identify potential roadblocks.
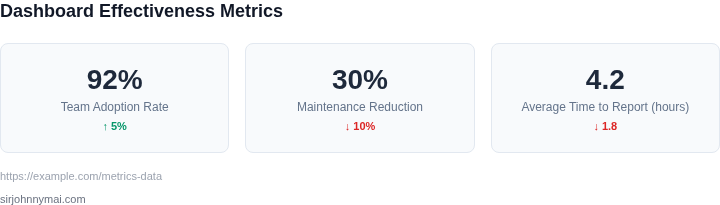
The pilot will be implemented in three phases: planning, execution, and evaluation. During the planning phase, we will define the requirements and scope of the pilot, identify the necessary tools and services, and develop a project plan. The execution phase will involve implementing the code coverage analysis and visualization dashboard, while the evaluation phase will focus on testing the solution and gathering feedback from stakeholders. By following this structured approach, we can ensure that the pilot is well-planned and executed, and that we achieve the desired outcomes.
Key Considerations and Tradeoffs
One key consideration for the pilot is ensuring that the code coverage analysis is accurate and reliable. This requires careful configuration of the analysis tools and integration with the visualization dashboard. Another consideration is minimizing the maintenance burden, which can be achieved by leveraging existing tools and services, and automating as much of the process as possible. However, this may require additional upfront investment in automation and integration. I weighed the tradeoffs between these considerations and determined that the benefits of a scalable solution outweigh the costs.
Additionally, we need to consider the potential impact on our development pipeline and ensure that the pilot does not disrupt our existing workflows. This can be achieved by running the pilot in parallel with our existing development processes and monitoring the results closely. By carefully managing the pilot and considering these key factors, we can ensure a successful outcome and set the stage for a full-scale deployment.
To further refine our approach, we can draw on the experience of other organizations that have implemented similar solutions. For example, we can study the approaches used by companies like Microsoft and Amazon to develop scalable code coverage analysis solutions. By learning from their experiences and incorporating their best practices into our own approach, we can improve the effectiveness of our solution and minimize the risks associated with implementation.
Our next step is to pull the last 90 days of code coverage data for Java and Python and calculate the average code coverage percentage for each language. This will provide a baseline for our pilot and enable us to measure the effectiveness of our solution.
Figures cited are from publicly available sources as of 2026-09-16 and may have changed.