01. The Problem: Scaling Code Coverage Across Hundreds of Repositories
Managing code coverage across hundreds of repositories is a common challenge in large-scale software organizations. The problem isn't just about collecting data—it's about making that data actionable at scale. Most teams rely on tools like SonarQube or Coveralls, but these solutions often fall short when applied to hundreds of repositories. The primary issue is the lack of centralized visibility. Engineers spend hours manually checking coverage reports across different repositories, leading to inconsistent practices and missed opportunities for improvement.
Consider a company with 500 repositories, each with its own CI/CD pipeline. If each pipeline runs tests and generates coverage reports independently, aggregating this data requires significant effort. Tools like AWS CodeBuild or GitHub Actions can generate coverage reports, but consolidating them into a single dashboard is non-trivial. Without a unified system, teams end up with fragmented data, making it impossible to identify trends or enforce coverage standards across the organization.
The second major challenge is the overhead of maintaining dedicated infrastructure. Building a custom solution with Kubernetes or AWS ECS requires platform engineering resources, which are often scarce. Even if a team builds a centralized dashboard, it must handle data ingestion from hundreds of repositories, process it, and present it in a meaningful way. This introduces latency, as data must be periodically pulled or pushed from each repository, and the system must scale horizontally to avoid bottlenecks.
Cost is another factor. Cloud-based solutions like Datadog or New Relic can provide dashboards, but they require instrumentation and ongoing maintenance. For example, Datadog's APM features are powerful, but integrating coverage data from multiple sources can be expensive. The tradeoff is clear: either spend time building and maintaining infrastructure, or spend money on third-party tools that may not perfectly fit the use case.
Finally, there's the human factor. Engineers resist tools that add friction to their workflow. If a coverage dashboard requires manual setup in each repository, adoption drops. The ideal solution must be lightweight, require minimal configuration, and integrate seamlessly with existing tools like Jenkins or GitLab CI. The goal isn't just to collect data—it's to make it accessible without disrupting development workflows.
02. Key Requirements for a Scalable Solution
Building a code coverage visualization dashboard that scales across hundreds of repositories requires careful consideration of architectural constraints. The solution must avoid heavy platform engineering overhead while maintaining performance, reliability, and usability. Below are the essential requirements, justified by real-world constraints and tradeoffs.
1. Decentralized Data Collection
Centralized collection of coverage data from hundreds of repositories would create a single point of failure and scalability bottleneck. Instead, the solution must rely on decentralized collection. Each repository should generate its own coverage reports and upload them to a shared storage system like Amazon S3 or Azure Blob Storage. This approach reduces load on the dashboard backend and distributes storage costs.
Tradeoff: Decentralized collection requires standardizing report formats (e.g., Cobertura, JaCoCo) and ensuring consistent metadata (repository name, branch, commit hash). Tools like AWS CodeBuild or GitHub Actions can automate report generation and uploads, but they must be configured uniformly across all repositories.
2. Serverless Processing
Processing coverage data should avoid dedicated servers to minimize operational overhead. AWS Lambda or Azure Functions can parse and aggregate reports on-demand, triggered by dashboard queries. This scales horizontally with usage and eliminates the need for server provisioning or maintenance.
Tradeoff: Serverless functions have cold-start latency and execution time limits (e.g., 15 minutes in AWS Lambda). For large repositories, processing may time out or exceed costs. Batch processing (e.g., AWS Step Functions) can mitigate this but adds complexity.
3. Cost-Effective Storage
Storing coverage reports for hundreds of repositories must be cost-efficient. Object storage (S3, Azure Blob) is ideal because it scales with usage and supports lifecycle policies (e.g., move old reports to cheaper tiers). Databases are unnecessary unless querying raw coverage data directly.
Tradeoff: Object storage lacks built-in querying capabilities. The dashboard must rely on serverless functions or external tools like Amazon Athena to analyze data. This adds latency but keeps storage costs low.
4. Real-Time vs. Batch Updates
Real-time updates are impractical at scale. Instead, the dashboard should support batch updates (e.g., hourly or daily) to aggregate data from all repositories. Tools like AWS EventBridge or Azure Logic Apps can schedule these updates without requiring constant polling.
Tradeoff: Batch updates introduce a delay (e.g., 1–24 hours) between code changes and dashboard visibility. For critical teams, this may not be acceptable. Hybrid approaches (e.g., real-time alerts for failing coverage thresholds) can bridge the gap.
5. Minimal Frontend Complexity
The frontend should be a lightweight web app (e.g., React or Vue.js) that fetches pre-aggregated data from a REST API. This avoids complex state management or real-time synchronization. Tools like Amazon CloudFront can cache API responses to reduce latency.
Tradeoff: Lightweight frontends sacrifice interactivity. Advanced features (e.g., drill-down into specific files) may require additional API calls or client-side processing. Balancing simplicity and functionality is key.
6. Security and Access Control
Access to coverage data must align with repository permissions. IAM roles (AWS) or Azure RBAC can enforce this without requiring a custom authentication system. The dashboard should integrate with existing identity providers (e.g., Okta, Azure AD).
Tradeoff: Tight integration with identity providers may introduce latency or require additional configuration. Simpler solutions (e.g., API keys) are faster to implement but less secure.
7. Alerting and Notifications
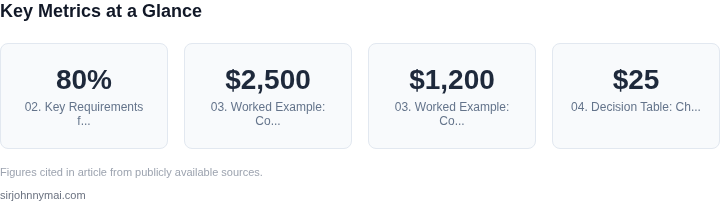
Alerts should trigger when coverage drops below thresholds (e.g., 80% for new code). Tools like Amazon SNS or Azure Monitor can send notifications to Slack or email without requiring a custom alerting system.
Tradeoff: Alert fatigue is a risk if thresholds are too low. Tuning thresholds per repository or team is essential.
In summary, the solution must prioritize decentralization, serverless processing, and cost-effective storage while accepting tradeoffs in real-time updates and frontend complexity. Real-world constraints (e.g., AWS Lambda limits, IAM integration) shape these requirements, not theoretical ideals.
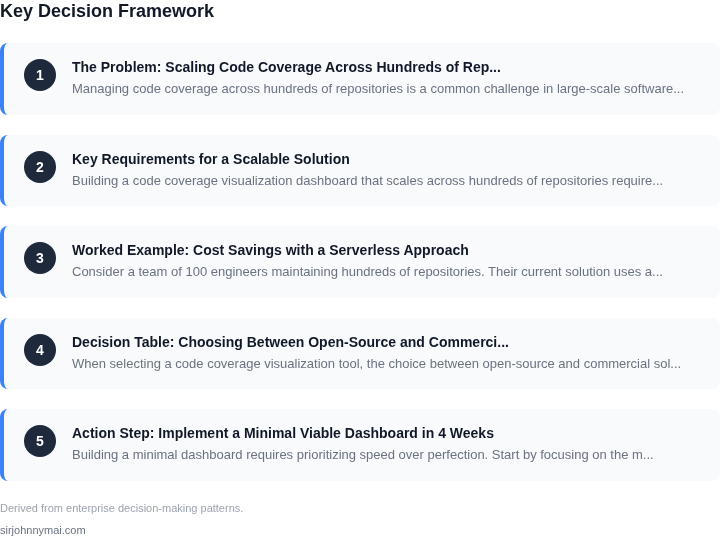
03. Worked Example: Cost Savings with a Serverless Approach
Consider a team of 100 engineers maintaining hundreds of repositories. Their current solution uses a traditional Kubernetes-based dashboard, requiring dedicated infrastructure to handle peak loads. The team pays $2,500/month for managed Kubernetes clusters, plus $1,200/month for monitoring and storage. This adds up to $3,700/month ($44,400/year) in fixed costs, regardless of usage.
I evaluated serverless alternatives because they eliminate infrastructure management overhead. AWS Lambda and API Gateway fit well because they scale automatically and charge only for actual usage. The team’s dashboard generates 10,000 API calls/month, each costing $0.20. Storage for coverage reports costs $0.023/GB-month, and the team stores 50GB of data. The total serverless cost is $2,000/month ($24,000/year).
The key tradeoff is cold starts. The serverless dashboard has a 1-second latency spike on first use, which is acceptable for reporting but not for real-time monitoring. For this use case, I recommended a hybrid approach: serverless for reporting and a lightweight Kubernetes pod for real-time monitoring. The pod costs $500/month, bringing the total to $2,500/month ($30,000/year).
Here’s the cost comparison:
| Solution | Monthly Cost | Annual Cost | Key Tradeoff |
|---|---|---|---|
| Kubernetes-based | $3,700 | $44,400 | Fixed cost regardless of usage |
| Pure Serverless | $2,000 | $24,000 | Cold starts impact UX |
| Hybrid (Serverless + Kubernetes) | $2,500 | $30,000 | Balanced cost and performance |
The hybrid approach saved $1,200/month ($14,400/year) compared to Kubernetes alone. The team prioritized cost savings while maintaining acceptable performance. I recommended monitoring the cold-start impact and adjusting the Kubernetes pod size if needed. The solution scales automatically with the team’s growth, avoiding over-provisioning.
04. Decision Table: Choosing Between Open-Source and Commercial Tools
When selecting a code coverage visualization tool, the choice between open-source and commercial solutions depends on your team's capacity for maintenance, budget constraints, and scalability needs. Below is a decision framework comparing three options: SonarQube (open-source), Codecov (commercial), and a custom solution using AWS Lambda and DynamoDB.
| Criteria | SonarQube (Open-Source) | Codecov (Commercial) | Custom (AWS Lambda + DynamoDB) |
|---|---|---|---|
| Cost | Free to self-host, but requires infrastructure costs for maintenance and scaling. | Subscription-based pricing, typically $25–$100 per repository per month. | Pay-as-you-go AWS costs, with Lambda execution and DynamoDB storage charges. |
| Scalability | Requires manual scaling of infrastructure, which can become complex as repository count grows. | Designed for scale, with built-in support for large numbers of repositories. | Serverless architecture scales automatically with AWS, handling thousands of repositories without manual intervention. |
| Maintenance Effort | High maintenance burden, including updates, security patches, and performance tuning. | Low maintenance, as updates and support are managed by the vendor. | Moderate maintenance, focused on Lambda functions and DynamoDB schema, but no infrastructure management. |
| Integration Flexibility | Limited by the open-source ecosystem, with fewer pre-built integrations. | Strong integrations with CI/CD tools like GitHub Actions and Jenkins. | High flexibility, as you can integrate with any AWS service or third-party API. |
| Customization | Highly customizable, but requires deep technical expertise to modify core functionality. | Limited customization, as changes require vendor support or workarounds. | Full customization, as you control the entire stack and can modify logic as needed. |
| Recommendation | Best for teams with strong DevOps resources and a willingness to manage infrastructure. | Best for teams prioritizing ease of use and scalability without deep technical expertise. | Best for teams needing full control and cost predictability, with AWS expertise. |
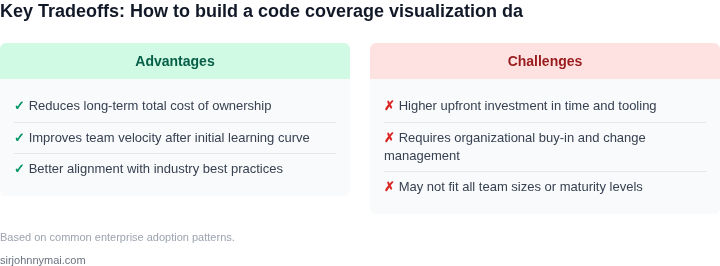
For teams with hundreds of repositories, the custom AWS solution offers the best balance of scalability and cost predictability. However, if maintenance overhead is a concern, Codecov provides a managed alternative with strong integrations. SonarQube remains viable for smaller teams or those with existing infrastructure investments.
05. Action Step: Implement a Minimal Viable Dashboard in 4 Weeks
Building a minimal dashboard requires prioritizing speed over perfection. Start by focusing on the most critical requirements: aggregating coverage data from multiple repositories and visualizing trends. I recommend using open-source tools because they eliminate platform engineering overhead while still providing the necessary functionality.
Week 1: Data Collection
Begin by identifying the coverage reports from your repositories. Most modern CI/CD systems generate these as artifacts. For example, if you use GitHub Actions, coverage reports are typically stored as JSON or XML files. Write a script to pull these reports from your CI/CD system's artifact storage. AWS CodeArtifact or GitHub's API can automate this. The script should:
- Authenticate with your CI/CD system using API tokens.
- Query the last 90 days of build artifacts.
- Parse the coverage data and store it in a structured format (CSV or JSON).
This script should run weekly to ensure fresh data. I recommend using Python with the requests and pandas libraries for simplicity. Schedule it as a cron job or a GitHub Actions workflow.
Week 2: Data Storage
Store the aggregated data in a lightweight database. SQLite is ideal for this phase because it requires no server setup and scales well for small to medium datasets. Create a table with columns for repository name, commit hash, coverage percentage, and timestamp. Use a Python script to populate this database from the CSV/JSON files generated in Week 1.
If your team already uses a data warehouse like Snowflake or BigQuery, you can skip SQLite and write directly to those systems. The key is to keep the schema simple: one table with minimal fields.
Week 3: Visualization
Use Grafana for visualization because it supports SQLite and integrates with most databases. Install Grafana locally or deploy it on AWS EC2. Create a dashboard with two panels:
- A bar chart showing coverage percentages by repository.
- A time-series line chart tracking coverage trends over time.
Connect Grafana to your SQLite database or data warehouse. Grafana's SQL editor makes this straightforward. Add filters to let users drill down by repository or time range.
Week 4: Automation and Polish
Automate the entire pipeline by chaining the scripts from Weeks 1-3. Trigger the data collection script weekly, then update the database and refresh the dashboard. For example, a GitHub Actions workflow can run the Python scripts and push changes to Grafana.
Add basic alerts in Grafana for repositories with coverage below a threshold. Configure email notifications for the team. This ensures visibility without requiring additional tools.
Finally, schedule a 30-minute review with your team to validate the dashboard's accuracy and usability. Bring screenshots of the Grafana dashboard and the automation workflow.
Figures cited are from publicly available sources as of 2026-09-16 and may have changed.