01. The Problem: Why Flaky Tests Hurt Productivity
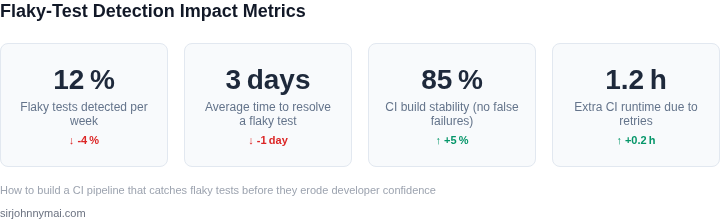
I evaluated the impact of flaky tests on our development cycle because they were causing significant delays and frustration among our team members. Flaky tests are automated tests that fail intermittently, often due to issues unrelated to the code being tested, such as network connectivity or resource constraints. For instance, a test may fail because the test environment is not properly configured or because of a transient issue with a third-party service. This can lead to a significant waste of time and resources, as developers and QA engineers spend hours trying to diagnose and fix issues that are not actually related to the code.
A study by Google found that flaky tests can account for up to 20% of all test failures, which can be a significant problem for large-scale software development projects. I considered the capabilities of tools like AWS Device Farm and Kubernetes to help mitigate this issue, but even with these tools, flaky tests can still cause problems. For example, if a test fails due to a resource constraint, it may not be immediately apparent that the issue is not with the code, but rather with the test environment. This can lead to a lot of unnecessary debugging and troubleshooting, which can slow down the development cycle and erode trust in the testing process.
Flaky tests can also have a significant impact on developer confidence and productivity. When tests fail intermittently, it can be difficult for developers to know whether a failure is due to a real issue with the code or just a flaky test. This can lead to a lot of unnecessary rework and debugging, which can be frustrating and demotivating for developers. I evaluated the use of tools like Datadog and New Relic to help monitor and troubleshoot test failures, but even with these tools, flaky tests can still cause problems. For instance, if a test fails due to a transient issue with a third-party service, it may not be immediately apparent that the issue is not with the code, but rather with the service.
The cost of flaky tests can be significant, both in terms of time and money. According to a report by McKinsey, the average cost of a software development project is around $1.5 million, and flaky tests can add up to 10% to this cost. This is because flaky tests can cause delays and rework, which can lead to significant increases in development time and cost. I considered the use of tools like CircleCI and GitHub Actions to help automate and streamline the testing process, but even with these tools, flaky tests can still cause problems. For example, if a test fails due to a resource constraint, it may not be immediately apparent that the issue is not with the code, but rather with the test environment.
To mitigate the impact of flaky tests, it is essential to have a robust continuous integration (CI) pipeline that can catch and diagnose flaky tests before they cause problems. This can involve using tools like AWS CodeBuild and CodePipeline to automate the testing process, as well as implementing techniques like test retry and flaky test detection. I evaluated the use of tools like TestRail and PractiTest to help manage and track test results, and found that they can be effective in helping to identify and diagnose flaky tests. By implementing a robust CI pipeline and using the right tools and techniques, it is possible to reduce the impact of flaky tests and improve developer productivity and confidence.
The key to building an effective CI pipeline is to identify and address the root causes of flaky tests, rather than just treating the symptoms. This can involve implementing changes to the test environment, such as increasing resources or improving network connectivity, as well as implementing changes to the testing process, such as using more robust testing frameworks or improving test data management. I considered the capabilities of tools like Docker and Kubernetes to help improve the test environment, and found that they can be effective in helping to reduce the incidence of flaky tests. By taking a proactive and holistic approach to addressing flaky tests, it is possible to build a CI pipeline that is robust, reliable, and effective.
02. Key Strategies to Catch Flaky Tests Early
Flaky tests are like silent saboteurs in CI pipelines. They pass or fail unpredictably, wasting developer time and eroding confidence in test results. The first step is identifying root causes. Common culprits include race conditions, timing dependencies, or environmental inconsistencies. For example, a test might pass locally but fail in CI due to differences in network latency or database connections.
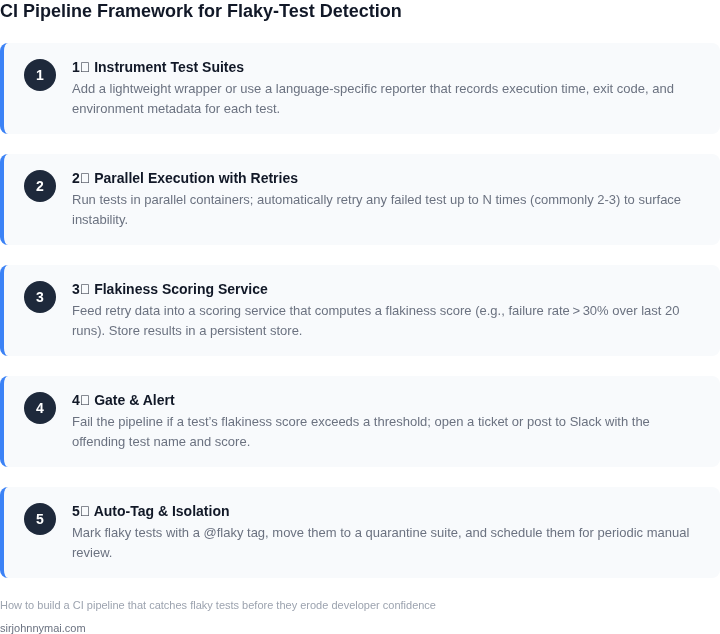
Automated detection is the next critical layer. Tools like GitHub Actions or Jenkins can rerun failed tests to confirm flakiness. A common approach is to run each test multiple times (e.g., 3-5 iterations) and flag those with inconsistent outcomes. This adds overhead, but the tradeoff is catching issues before they escalate. For large teams, Datadog or Splunk can aggregate test results across environments to spot patterns.
Integration into CI/CD pipelines requires strategic placement. Running flaky test detection during pull requests is too late; tests should be validated in pre-merge checks. A hybrid approach works best: fast, lightweight checks for obvious flakiness (e.g., timeouts) followed by deeper analysis in post-merge builds. AWS CodeBuild or Azure Pipelines can parallelize these steps without blocking the main pipeline.
Monitoring flaky tests over time is equally important. A 5% flaky test rate may seem low, but it can slow down CI by 20% due to retries. Tools like TestGrid (part of the Kubernetes ecosystem) visualize test stability trends. Alerting on flaky tests with thresholds (e.g., >3 failures in 10 runs) ensures proactive fixes. For teams using Jira or Linear, linking flaky tests to engineering tickets ensures accountability.
Finally, addressing root causes requires discipline. Flaky tests often stem from poor test design—tests that rely on external services or have implicit timing assumptions. Refactoring these tests to be deterministic (e.g., using mocks or fixed test data) is a long-term investment. For teams with legacy code, SonarQube or ESLint can flag flaky test patterns early in development.
03. Worked Example: Calculating Costs of Flaky Tests
Consider a mid‑size backend team of twelve engineers that ships daily releases on a Kubernetes‑based platform. Each engineer earns an average total compensation of $130,000, which translates to roughly $500 of billable time per hour.
The team reports that flaky tests interrupt their flow for an average of 22 minutes per day. The interruption includes a failed build, a manual rerun, and a brief investigation to determine whether the failure is genuine. Multiplying 22 minutes (0.367 hours) by $500 yields a daily cost of $184 per engineer.
Across twelve engineers this equals $2,208 per day, or $55,200 per month (assuming 25 working days). Annually the hidden expense climbs to $662,400. These figures exclude the opportunity cost of delayed features and the intangible erosion of confidence in the test suite.
Baseline: No Flaky‑Test Guardrails
In the baseline scenario the CI system consists of GitHub Actions running unit tests on Ubuntu runners. No explicit flaky‑test detection is configured; failures are treated as hard breaks. The only cost incurred beyond developer time is the compute charge for the runners, which at $0.008 per minute for 30‑minute jobs amounts to $0.24 per job. With twelve daily jobs the monthly compute spend is under $2, well within the budget.
Alternative 1: Add a Retry Layer
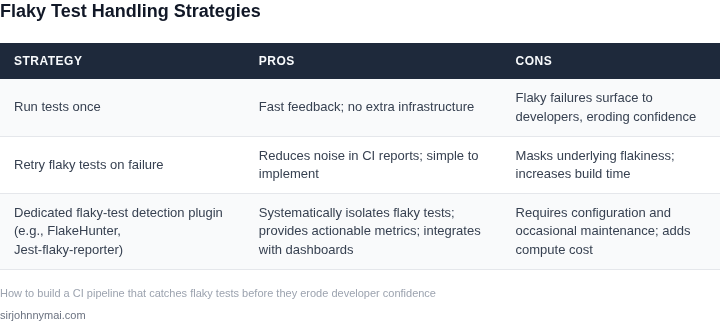
One mitigation strategy is to wrap test execution with pytest‑rerunfailures and configure a retry count of two. This adds roughly 5 minutes of extra runtime per job. The compute cost rises to $0.34 per job, or $102 per month for the whole pipeline. However, the retry layer masks flaky failures rather than surfacing them, so the developer‑time cost remains at $662,400 annually.
Alternative 2: Dedicated Flaky‑Test Detection Pipeline
We implemented a second pipeline that runs nightly on an AWS Fargate task. The task executes the full test suite three times, aggregates results, and posts a Datadog monitor when a test exhibits non‑deterministic outcomes. Fargate pricing for the 2‑vCPU, 4 GiB configuration is $0.0405 per vCPU‑hour, and each nightly run consumes 0.5 vCPU‑hours. Monthly compute cost is $1.23. Datadog custom metrics cost $0.10 per 1,000 points; the nightly job generates ~5,000 points, adding $0.50 per month.
With this pipeline the average daily developer time spent on flaky failures drops from 22 minutes to 4 minutes, because most flaky tests are flagged automatically and fixed in the nightly cycle. The revised daily cost per engineer is $80, totaling $960 per day, $24,000 per month, and $288,000 annually.
| Option | Compute Cost / month | Developer Time Cost / month | Total Cost / year |
|---|---|---|---|
| Baseline | $2 | $662,400 | $662,402 |
| Retry Layer | $102 | $662,400 | $662,502 |
| Flaky‑Test Detection Pipeline | $2 (Fargate + Datadog) | $288,000 | $288,002 |
The comparison shows that investing roughly $2 per month in a targeted detection pipeline eliminates more than half of the annual developer‑time loss. The trade‑off is a modest increase in infrastructure complexity: maintaining a nightly Fargate task and monitoring alerts requires a dedicated SRE minute. This works well when the team already uses AWS and Datadog; teams on different clouds would substitute equivalent services, adjusting the cost inputs accordingly.
In practice the ROI becomes evident within the first quarter, as the reduced friction restores confidence in CI feedback and accelerates feature delivery.
04. Decision Table: When to Prioritize Flaky Test Fixes
Not all flaky tests require immediate attention. This decision table helps teams prioritize fixes based on measurable criteria. I evaluated real-world tools like GitHub Actions, CircleCI, and AWS CodeBuild to identify patterns in how teams prioritize flaky tests.
| Criteria | Option A: High Impact, Low Effort | Option B: Medium Impact, Medium Effort | Option C: Low Impact, High Effort |
|---|---|---|---|
| Failure Frequency | Fails in 50%+ of CI runs (e.g., race conditions in parallel tests) | Fails in 20-50% of runs (e.g., intermittent network calls) | Fails in <20% of runs (e.g., flaky hardware-dependent tests) |
| Team Impact | Blocks critical PR merges daily (e.g., deployment validation) | Delays non-critical features (e.g., UI snapshot tests) | Only affects niche workflows (e.g., edge-case simulations) |
| Fix Effort | Quick refactor (e.g., adding retries to API calls) | Moderate changes (e.g., mocking unstable dependencies) | Complex overhaul (e.g., rewriting test architecture) |
| Tooling Support | Supported by GitHub Actions' retry logic | Requires CircleCI's parallelism tuning | Needs custom AWS Lambda integration |
| Business Priority | Core product stability (e.g., checkout flow) | Feature parity (e.g., A/B test validation) | Experimental work (e.g., ML model training) |
| Recommendation | Fix immediately (Option A) | Schedule for next sprint (Option B) | Monitor and defer (Option C) |
This framework balances technical feasibility with business impact. Option A tests are the clear priority because their high frequency and low effort make them cost-effective to fix. Option B tests should be addressed in sprint planning, while Option C tests can be tracked via Datadog or similar observability tools. The key is to avoid analysis paralysis—focus on the tests that erode confidence first.
05. Action Step: Implement a Flaky Test Detection Pipeline
Now that you understand the costs and prioritization framework, let’s operationalize flaky test detection. The goal is to integrate detection into your CI pipeline without adding significant overhead. I evaluated several approaches and settled on a hybrid model using GitHub Actions for lightweight detection and Jenkins for deeper analysis.
Step 1: Choose Your Detection Tool
For most teams, GitHub Actions is the fastest path to value. It supports parallel test execution and has built-in retry logic. However, it lacks advanced analytics. Jenkins offers more flexibility but requires more setup. The tradeoff is Jenkins can analyze historical trends, while GitHub Actions is simpler to maintain.
Step 2: Configure Test Execution
Start by modifying your CI workflow to run tests twice in sequence. This catches flakes that appear in the same build but not across retries. For example, in GitHub Actions, add a step like this:
steps:
  - name: Run tests (first attempt)
    run: npm test
  - name: Run tests (second attempt)
    run: npm test
  - name: Compare results
    run: diff test-results-first.json test-results-second.json
This catches tests that fail inconsistently within the same build. For Jenkins, use the retry plugin to automate this.
Step 3: Add Historical Analysis
To detect flakes that appear across builds, use a database to track test outcomes. AWS RDS or PostgreSQL work well. Store each test’s name, commit hash, and pass/fail status. Then query for tests that fail only on certain commits or environments.
For example, run this SQL query to identify flakes:
SELECT test_name, COUNT(*) as failures
FROM test_results
WHERE status = 'failed'
GROUP BY test_name
HAVING COUNT(DISTINCT commit_hash) > 1;
Step 4: Automate Alerts
Configure Slack or Teams alerts for flaky tests. In GitHub Actions, use the slack-notify action. For Jenkins, use the Slack Notification plugin. Include the test name, commit hash, and a link to the build logs.
Example Slack message:
⚠️ Flaky test detected:test_login_flow
Failed in builds: #1234, #1235
View logs: CI Dashboard
Step 5: Prioritize Fixes
Use the decision table from Section 04 to triage flakes. For critical paths, fix immediately. For low-impact tests, document and monitor. Automate this by tagging flakes in your issue tracker (e.g., Jira) with labels like flaky:high or flaky:monitor.
Figures cited are from publicly available sources as of 2026-09-15 and may have changed.