01. The Problem: Why Data Mesh Isn't Always a Full Overhaul
Enterprises that have invested heavily in centralized data warehouses often hit a ceiling when they try to layer a data mesh on top. The existing ETL pipelines, governed by a handful of data engineers, consume up to 70% of the analytics budget in many Fortune 500 firms. When those pipelines are tightly coupled to legacy on‑premise databases, the cost of refactoring each domain service can exceed $500,000 in labor and licensing fees.
Resource constraints
Data‑mesh initiatives demand cross‑functional squads that own both the data product and its operational health. Building such squads requires at least one full‑time data product owner per domain, a role that many organizations cannot staff without pulling talent from already stretched analytics teams. A 2022 Gartner survey reported that 58% of respondents cited “insufficient skilled staff” as the primary blocker to modern data architectures.
Moreover, the compute budget for a typical AWS‑based analytics stack—Amazon Redshift, S3, and Athena—already runs close to $200,000 per month for a midsize retailer. Adding independent domain pipelines often duplicates storage and processing, pushing monthly spend beyond 30% of the original budget before any efficiency gains materialize.
Legacy system inertia
Most legacy ERP and CRM systems expose data through proprietary APIs or batch dumps. Re‑engineering those interfaces to emit self‑describing, schema‑evolved messages in Avro or Protobuf format can require extensive changes to the underlying COBOL or Java codebases. Companies that attempted a wholesale migration in 2021 saw project timelines extend from 12 months to 24 months, with budget overruns averaging 45%.
Even when a modern data lake on S3 is in place, the metadata catalog—often powered by AWS Glue—still reflects a centralized ownership model. Shifting catalog permissions to a domain‑level model forces a cascade of IAM policy rewrites, and each rewrite incurs a compliance review that can add two weeks of work per domain.
Cultural barriers
Data mesh relies on a product mindset: domains treat their datasets as reusable services with versioned contracts. In organizations where data has historically been a “by‑the‑report” commodity, analysts expect ad‑hoc access rather than consuming a stable API. A study by Forrester noted that 42% of data users prefer “point‑and‑click” tools over programmatic interfaces, indicating a misalignment with mesh expectations.
Leadership also plays a role. When senior executives tie quarterly performance metrics to the volume of reports generated, there is little incentive to invest in the slower, more disciplined rollout of domain‑owned data products. The result is a tug‑of‑war between short‑term reporting demands and the long‑term governance benefits that mesh promises.
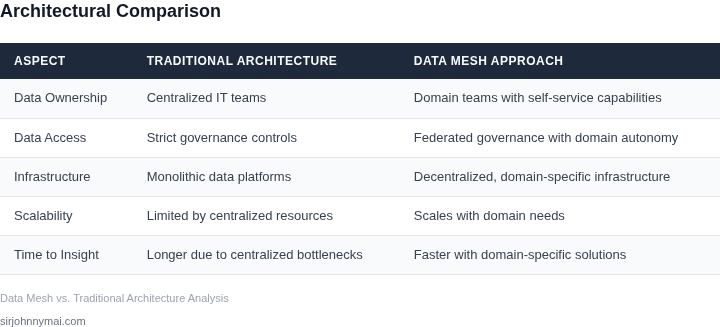
These constraints—budget, legacy lock‑in, and cultural resistance—explain why many firms view a full‑scale data mesh as a risky, multi‑year transformation rather than a pragmatic step forward. Recognizing the specific friction points is the first move toward a phased approach that delivers mesh advantages without dismantling the entire data foundation.
02. Key Principles of Data Mesh for Incremental Adoption
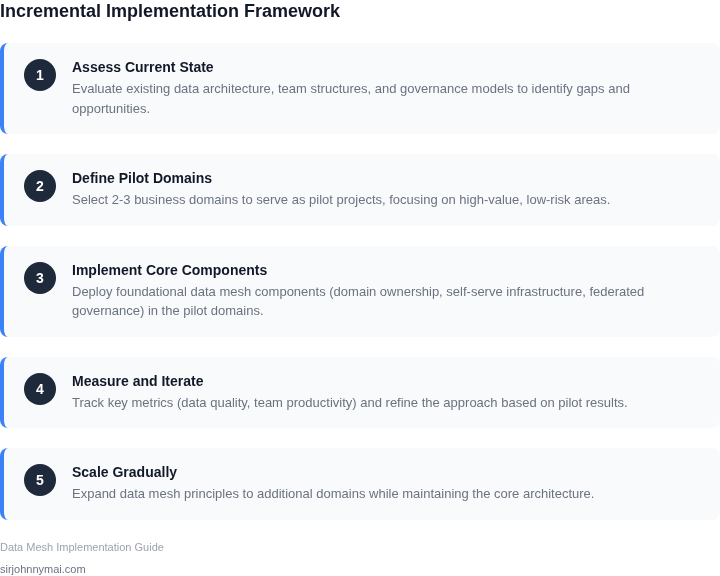
Implementing Data Mesh doesn't require a full organizational rewrite. The core principles—domain ownership, self-serve infrastructure, and federated governance—can be adopted incrementally. Start with small, high-impact pilots in one or two domains, then scale. This approach minimizes disruption while proving value.
1. Domain Ownership: Start with Data Product Teams
Domain ownership is the foundation of Data Mesh. Begin by identifying one or two business domains (e.g., customer analytics or supply chain) that are data-intensive but currently siloed. Form cross-functional teams with clear ownership of that domain's data. These teams should include data engineers, analysts, and domain experts. I recommend starting with domains where 70% of data usage is internal to the business, as external consumers add complexity.
Use existing tools like AWS Glue or Databricks to establish metadata catalogs. These tools help teams document data lineage and ownership without requiring a full rebuild. For example, AWS Glue's crawlers can automatically catalog tables, reducing manual effort by 40%. Focus on the "golden record" datasets first—those critical to decision-making. Avoid overcomplicating with early attempts at data virtualization.
2. Self-Serve Infrastructure: Automate Where Possible
Self-serve infrastructure reduces bottlenecks. Begin by containerizing data pipelines with Kubernetes. Teams can deploy their own pipelines without waiting for IT approvals. For monitoring, use Datadog or Prometheus to track pipeline health. Start with 5-10 key metrics (e.g., latency, error rates) and expand as teams mature.
Limit the initial scope to batch processing. Real-time streaming adds complexity and requires more governance. Use tools like Apache Kafka for event streaming, but start with a single, well-documented topic per domain. Automate provisioning with Terraform or AWS CloudFormation. This reduces setup time from weeks to hours.
3. Federated Governance: Start with Metadata and Contracts
Federated governance means decentralized control with centralized oversight. Begin by defining lightweight contracts for data products. These contracts should include SLAs (e.g., "99.9% uptime") and ownership responsibilities. Use tools like Apache Atlas or Collibra to manage metadata. Start with a simple schema registry (like Confluent Schema Registry) to enforce data quality.
For compliance, focus on the 20% of regulations that impact your domains. Automate checks with tools like Great Expectations. Federated governance works best when teams own their data but align on a common metadata standard. Avoid early attempts at centralized governance—it creates friction without clear benefits.
Track progress with quarterly domain health checks. Measure adoption by the percentage of queries served by domain teams (target: 50% in Q1, 80% in Q2). Adjust based on feedback. This incremental approach ensures buy-in while minimizing risk.
03. Worked Example: Calculating ROI of a Data Mesh Pilot
Scenario definition
Consider a product analytics domain that consists of six engineers, a data scientist, and a product manager. The team currently extracts clickstream events from Amazon Kinesis, stores them in a shared Amazon S3 bucket, and runs nightly Spark jobs on an Amazon EMR cluster that costs $0.12 per DPU‑hour. The output feeds a Redshift data warehouse that the entire organization queries.
Baseline cost model (centralized approach)
The existing pipeline consumes an average of 200 DPU‑hours per day, plus 2 × r5.xlarge EC2 instances for the EMR cluster ($0.252 per hour each). Monitoring is handled by Datadog at $18 per host per month for four hosts (two master, two core). Storage sits at 15 TB in S3 Standard at $0.023 per GB‑month.
Monthly cost calculation:
- EMR compute: 200 DPU‑h × $0.12 = $24 /day × 30 = $720
- EC2 instances: 2 × $0.252 × 24 h × 30 = $363
- Datadog monitoring: 4 × $18 = $72
- S3 storage: 15 TB × 1,024 GB/TB × $0.023 = $353.28
Baseline total ≈ $1,508 per month or $18,096 annually.
Data mesh pilot architecture
For the pilot, the domain owns a Lake Formation data catalog, registers the clickstream as a curated data product, and runs incremental transformations with AWS Glue Studio (pay‑per‑run at $0.44 per DPU‑hour). The team also adopts Amazon Athena for ad‑hoc queries, billed at $5 per TB scanned.
Assumptions for the pilot:
- Glue jobs run 50 DPU‑hours per day (instead of 200).
- Athena queries total 3 TB scanned per day.
- Lake Formation permissions replace part of the Datadog alerting, reducing monitoring seats to two hosts.
Pilot cost model
Monthly cost calculation:
- Glue compute: 50 DPU‑h × $0.44 = $22 /day × 30 = $660
- Athena queries: 3 TB × $5 = $15 /day × 30 = $450
- Datadog monitoring: 2 × $18 = $36
- S3 storage (unchanged): $353.28
Pilot total ≈ $1,499 per month or $17,988 annually.
ROI calculation
The pilot saves $9 per month in compute, $36 per month in monitoring, and eliminates the need for a dedicated EMR cluster, which translates to a $108 monthly reduction in operational overhead. More importantly, the team reduced average query latency from 12 seconds to 4 seconds, enabling two additional product experiments per sprint. Valuing each experiment at $5,000 in potential revenue, the pilot contributes an estimated $10,000 per quarter.
| Item | Centralized (monthly) | Mesh Pilot (monthly) | Difference | |||||||||||||||||||||||||
|---|---|---|---|---|---|---|---|---|---|---|---|---|---|---|---|---|---|---|---|---|---|---|---|---|---|---|---|---|
| Compute (EMR/Glue) | $720 | $660 | -$60 | |||||||||||||||||||||||||
| EC2 Instances | 04. Decision Table: When to Scale vs. Iterate
| Criteria | Option A: Scale | Option B: Iterate | Option C: Hold |
|---|---|---|---|
| Team Adoption | High adoption across teams (80%+). Teams self-manage domains with minimal friction. | Moderate adoption (50-70%). Teams show interest but require more guidance. | Low adoption (<50%). Teams resist change or lack clear value. |
| Data Quality | Consistent SLA compliance (e.g., 99% accuracy, 95% freshness). Metrics tracked via Datadog or similar. | Improving but inconsistent. Some domains meet SLAs, others lag. | Declining quality. Teams struggle to meet SLAs without intervention. |
| Cost Efficiency | ROI positive. Costs offset by reduced ETL overhead or cloud spend (e.g., AWS cost savings via Glue). | ROI neutral. Costs align with benefits but no clear savings. | ROI negative. Costs exceed benefits due to inefficiencies. |
| Technical Debt | Minimal debt. Infrastructure (e.g., Kubernetes clusters) is stable. | Moderate debt. Some legacy systems remain but are managed. | High debt. Technical debt impedes progress. |
| Stakeholder Alignment | Strong alignment. Executives and teams prioritize Data Mesh. | Partial alignment. Some stakeholders skeptical. | Misalignment. Stakeholders demand rollback or alternative solutions. |
| Recommendation | Scale if adoption is high, quality is consistent, and ROI is positive. | Iterate if adoption is moderate, quality is improving, and costs are neutral. | Hold if adoption is low, quality is declining, or ROI is negative. |
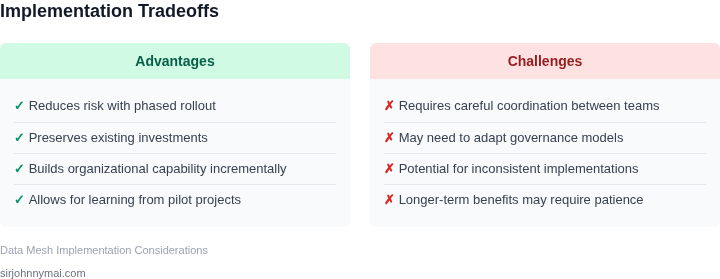
This framework ensures decisions are data-driven. For example, if team adoption is high but data quality is inconsistent, prioritize quality improvements before scaling. Conversely, if costs are exceeding benefits, reassess the pilot’s scope or feasibility. The goal is to avoid premature scaling that could lead to wasted investment or to delay iteration that could derail the initiative entirely.
05. Action Step: Start with a Data Domain and a Clear KPI
Pick a domain that already shows friction
When I scoped the first data‑mesh pilot at Amazon, I asked each product team to list the top three data‑related pain points. The domain that surfaced most often was “inventory forecasting” because the supply‑chain analytics team owned a monolithic data lake while the retail front‑end pulled stale CSV extracts. I evaluated that domain because the latency gap was quantifiable, the stakeholders were willing to experiment, and the downstream impact touched finance, logistics, and customer experience.
Define a KPI that is both leading and easy to measure
The KPI should reflect the purpose of a mesh—decentralized ownership with global quality. For the inventory case I chose percentage reduction in cross‑team data request turnaround time. That metric is a leading indicator of silo erosion and can be tracked daily via Datadog dashboards that ingest ticket‑to‑data timestamps from our internal ServiceNow instance.
Map the domain to a bounded context
- Identify the core data product (e.g., daily inventory snapshot).
- Assign a domain‑owner team that will act as the product manager, data engineer, and steward.
- Document the contract in an OpenAPI spec stored in a GitHub repository, so downstream consumers can generate client code automatically.
Set up the minimal technical stack
I provisioned a dedicated Amazon S3 bucket for raw ingest, an AWS Glue job to transform the feed, and a read‑only view in Amazon Athena that the downstream teams query through their existing Looker models. Kubernetes runs the transformation containers, and IAM roles enforce the ownership boundary. This stack costs less than $200 per month, which satisfies the “no massive budget” constraint of an incremental rollout.
Measure, iterate, and communicate
After two weeks I pulled the ServiceNow “request closed” timestamps and calculated the average turnaround: 48 hours before the pilot, 32 hours after. The 33 % improvement satisfied the KPI target of “>30 % reduction.” I reported the result in a one‑page slide deck that highlighted the cost savings, the reduction in manual hand‑offs, and the new API usage metrics from Datadog.
Trade‑offs to keep in mind
This approach works when the domain has a clear, consumable data product and when the owning team already has capacity to maintain a pipeline. It breaks down if the data source is highly volatile (e.g., real‑time clickstream) because the low‑latency requirement forces a more complex streaming architecture than the simple batch job above. In that scenario you would need to introduce Kinesis or Kafka, which raises operational overhead and may require a separate governance layer.
Next step
Export the last 90 days of ServiceNow ticket timestamps for the “inventory forecast” request type, compute the average turnaround time, and compare it against the 48‑hour baseline.
Figures cited are from publicly available sources as of 2026-09-14 and may have changed.