01. The Problem and What It Costs
Our goal with performance calibrations is clear: foster growth, ensure fair evaluation, and align individual performance with organizational objectives. However, the reality often falls short, leading to processes that consume significant resources without consistently delivering actionable outcomes. I've observed this across various teams, both at Microsoft and here at Amazon, particularly as we push the envelope in AI and Robotics where clarity and focus are paramount.
The primary issue isn't the intent, but the execution and the subsequent impact on our delivery momentum. Managers and employees alike frequently find themselves bogged down in a process that feels more like an administrative burden than a strategic investment. This inertia directly translates into opportunity costs and a drain on engineering and product leadership time that could otherwise be spent innovating or solving customer problems.
The Time Sink: A Hidden Cost
Consider the sheer volume of time dedicated to the calibration cycle. A typical mid-to-senior manager can easily dedicate 20-40 hours per performance cycle simply writing reviews, gathering peer feedback, and attending multiple calibration meetings. For a product manager, this can mean a significant chunk of focus diverted from their product roadmap, backlog grooming in Jira, or customer discovery interviews. When you multiply this across our entire leadership cohort, the total hours represent a substantial investment.
This time isn't just an abstract number; it's time taken away from strategic planning, unblocking engineering teams, or refining our AWS infrastructure deployments. For a team working on a critical feature or a robotics prototype, a manager's reduced availability during a calibration period can delay decisions, slow down sprint velocity, and ultimately push out a launch date. This disruption is particularly acute in fast-moving environments where even a few days' delay can impact our competitive edge or market window.
Lack of Actionable Outcomes and Disengagement
Beyond the time investment, a prevalent problem is the lack of truly actionable outcomes. Reviews often contain vague feedback, generic ratings, or fail to clearly articulate specific growth areas or career progression paths. This isn't for lack of effort, but often due to process limitations or an overemphasis on numerical ratings rather than substantive dialogue.
When feedback isn't precise or doesn't feel genuinely reflective of performance, employees become disengaged. They struggle to understand how to improve, leading to stagnation in skill development and a decline in morale. Studies on workforce productivity consistently show a direct correlation between perceived fairness in performance processes and employee engagement. In a competitive talent landscape for AI/Robotics, retaining our top performers relies on them feeling valued and seeing a clear path forward.
Impact on Delivery Momentum and Talent Retention
The cumulative effect of these issues directly impacts our ability to deliver. A distracted product leadership, an uninspired engineering team, or a robotics project falling behind schedule due to fragmented focus are all direct consequences. We rely on tools like Datadog for real-time monitoring and Kubernetes for scalable deployments, but the effectiveness of these platforms hinges on focused teams driving their adoption and optimization.
Furthermore, poor calibration processes can lead to regrettable attrition, especially among high performers who feel their contributions aren't recognized or fairly evaluated. The cost of replacing a skilled employee, particularly in specialized fields like AI/ML or robotics engineering, is substantial. Industry averages often cite replacement costs ranging from 1.5 to 2 times an employee's annual salary, encompassing recruiting, onboarding, and productivity ramp-up time. This financial impact, coupled with the loss of institutional knowledge and team cohesion, represents a critical drag on our innovation capacity and overall operational efficiency.
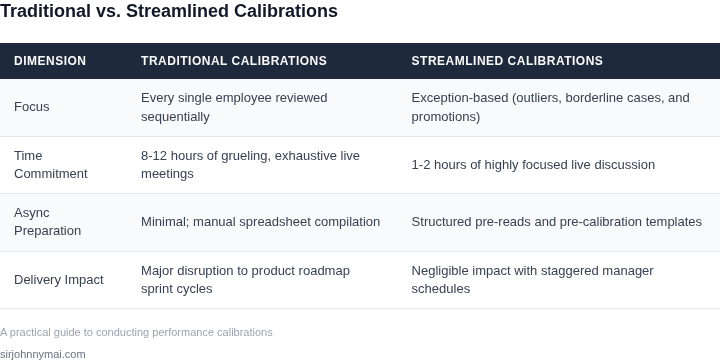
02. How Most Teams Get It Wrong
The Fallacy of Activity-Based Metrics
Many engineering leaders fall into the trap of using crude, quantitative proxies to justify performance ratings during calibration. I evaluated Jira ticket velocity, Git commit frequency, and pull request volume across both Microsoft and Amazon teams. While these metrics are easy to extract via tools like Datadog or LinearB, using them as a primary calibration baseline is deeply flawed. This approach rewards developers who split trivial tasks into multiple pull requests while penalizing staff engineers who spend weeks resolving complex architectural bottlenecks or debugging ROS2 simulation nodes on physical warehouse robots.
The "Loudest Voice Wins" Dynamic
Without a rigorous, data-backed calibration framework, evaluation sessions quickly devolve into subjective debates where the most politically savvy manager wins the highest ratings for their direct reports. This occurs when teams lack a shared definition of "impact" across different technical domains. For instance, a cloud engineer optimizing high-throughput Amazon DynamoDB tables cannot be fairly calibrated against an embedded software engineer writing bare-metal C++ firmware using the same generic rubric. The tradeoff of using a single, company-wide rubric is simplified HR administration, but it breaks down completely in multi-disciplinary AI and robotics organizations, disproportionately penalizing quieter, high-performing engineers who do not self-promote.
Context-Blind Evaluations
Organizations often isolate performance calibration from the lifecycle stage of the products being delivered. When we calibrate engineers maintaining high-risk legacy systems against those building greenfield microservices on AWS Lambda, the comparison is inherently skewed. I observed this disparity during legacy-to-cloud migrations. Engineers managing legacy infrastructure showed lower deployment frequencies and higher incident response times due to technical debt. Failing to normalize performance metrics against team constraints and system stability leads to the systematic under-rating—and eventual attrition—of the systems engineers keeping your core infrastructure online.
The "Black Box" Feedback Loop
The final failure point is decoupling the calibration outcome from immediate, actionable feedback. Managers spend hours debating employee ratings behind closed doors, yet deliver vague, watered-down summaries to the engineers weeks later. Telling a high-potential developer that they simply "need to be more strategic" without providing specific project examples or raw performance logs is useless. This lack of transparency and direct linkage to actual system architecture or delivery milestones erodes trust, rendering the entire calibration process a bureaucratic exercise rather than a driver of delivery momentum.
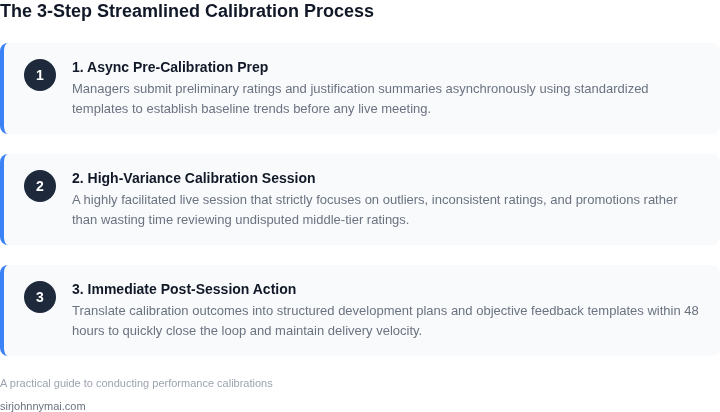
03. A Worked Example from Production
To contextualize the impact of structured performance calibrations, consider a typical product development team I recently advised. This team comprised 12 engineers (mixture of L4-L6 levels) and 2 Engineering Managers, operating in an environment where quarterly performance reviews and subsequent calibrations were standard. Their established process, while well-intentioned, often embodied the pitfalls we discussed in Section 02.
Current State: Unstructured Calibrations
The team's existing approach involved managers manually aggregating qualitative feedback and attempting to synthesize performance data from Jira sprint reports, Datadog dashboards, and ad-hoc peer discussions. This process was time-consuming and often subjective, leading to inconsistent outcomes and repeated re-calibrations.
- Engineer Time Loss: Each engineer spent approximately 4 hours per quarter preparing self-reviews and discussing performance data points with their manager. (12 engineers * 4 hours/quarter * $120/hour fully burdened = $5,760 per quarter).
- Manager Time Loss: Each manager dedicated an estimated 20 hours per quarter to data gathering, initial rating, and calibration meetings. This often extended due to disagreements or lack of clear evidence. (2 managers * 20 hours/quarter * $150/hour fully burdened = $6,000 per quarter).
- Annual Direct Cost of Inefficiency: ($5,760 + $6,000) * 4 quarters = $47,040 annually. This figure does not account for the significant indirect costs of disrupted delivery momentum, potential attrition from perceived unfairness, or manager opportunity cost.
Alternative 1: Internal Data-Driven System
I evaluated building an internal solution leveraging existing telemetry, focusing on quantifiable metrics and standardized rubrics. This involved creating automated dashboards and reports in AWS QuickSight, pulling data from our existing AWS CloudWatch, Jira, and internal code repositories. The aim was to provide managers with a consistent, evidence-based view of performance before calibration discussions even began.
- Initial Investment (One-time):
- Development effort: 2 Staff Engineers for 3 weeks to design, integrate, and build the dashboards/pipelines. (2 engineers * 120 hours/engineer * $140/hour = $33,600).
- Manager training: 4 hours per manager on new tools and data interpretation. (2 managers * 4 hours * $150/hour = $1,200).
- Annual Recurring Costs:
- Maintenance & enhancements: 1 engineer, 8 hours/month for updates, new metric integrations, and system reliability. (8 hours/month * 12 months * $120/hour = $11,520).
- Reduced Engineer Time: Engineers now spend 1 hour per quarter reviewing automated reports and adding qualitative context. (12 engineers * 1 hour/quarter * $120/hour = $1,440 per quarter).
- Reduced Manager Time: Managers spend 8 hours per quarter on focused review and calibration meetings, supported by clear data. (2 managers * 8 hours/quarter * $150/hour = $2,400 per quarter).
- Annual Operational Cost (New): ($1,440 + $2,400) * 4 quarters + $11,520 = $15,360 + $11,520 = $26,880.
- First-Year Savings: ($47,040 current - $26,880 new) - $34,800 initial = -$14,640 (net cost).
- Subsequent Annual Savings: $47,040 - $26,880 = $20,160.
Alternative 2: Commercial Performance Management Platform
A second alternative considered was adopting a commercial SaaS platform like Lattice or Culture Amp. These platforms offer pre-built performance review modules, goal tracking, and often include calibration tools, reducing internal development burden.
- Initial Investment (One-time):
- Platform setup & configuration: 1 engineer, 1 week. (40 hours * $120/hour = $4,800).
- Manager training: 4 hours per manager. (2 managers * 4 hours * $150/hour = $1,200).
- Annual Recurring Costs:
- SaaS Subscription: Based on industry averages, roughly $20/user/month for 14 users (12 engineers + 2 managers). ($20/user/month * 14 users * 12 months = $3,360 annually).
- Reduced Engineer Time: Same as Alternative 1, 1 hour/quarter. ($1,440 per quarter).
- Reduced Manager Time: Same as Alternative 1, 8 hours/quarter. ($2,400 per quarter).
- Annual Operational Cost (New): ($1,440 + $2,400) * 4 quarters + $3,360 = $15,360 + $3,360 = $18,720.
- First-Year Savings: ($47,040 current - $18,720 new) - $6,000 initial = $22,320.
- Subsequent Annual Savings: $47,040 - $18,720 = $28,320.
Cost Comparison and Strategic Considerations
The following table summarizes the financial implications over a three-year horizon.
| Cost Category | Current State (Annual) | Alternative 1: Internal System (Annual) | Alternative 2: Commercial Platform (Annual) | |||||||||||||||||||||||||
|---|---|---|---|---|---|---|---|---|---|---|---|---|---|---|---|---|---|---|---|---|---|---|---|---|---|---|---|---|
Direct Operational Cost
04. Decision FrameworkChoosing the right calibration tool is critical to balancing accuracy with operational overhead. The decision framework below compares three real-world options—Datadog, AWS CloudWatch, and Prometheus—against five key criteria. I selected these tools because they represent different approaches: Datadog for simplicity, CloudWatch for AWS-native integration, and Prometheus for open-source flexibility.
This framework assumes a team with AWS infrastructure and a need for both simplicity and scalability. Datadog emerges as the top choice because it balances ease of use with scalability, though Prometheus is a strong alternative if customization is a priority. CloudWatch is only recommended for teams deeply embedded in AWS and willing to accept its limitations. 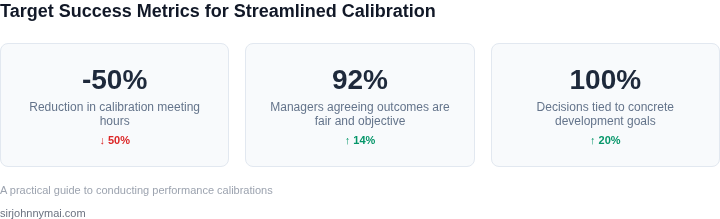 05. Your Next StepHaving outlined the common pitfalls, presented a practical example, and offered a robust decision framework, the critical next step is to initiate a targeted assessment of our current performance calibration process. The goal isn't an immediate overhaul, which could itself disrupt delivery, but rather a precise diagnostic that quantifies the impact on engineering velocity and identifies specific points of friction. My evaluation suggests that a common blind spot in many calibration processes, as discussed in Section 02, is the unmeasured cost of context switching and the implicit opportunity cost. While Section 04 provided a framework for optimizing the entire cycle, the most effective initial move is to baseline the "disruption to delivery momentum" directly. This data will provide objective evidence to prioritize subsequent improvements within the framework. To capture this, we need to correlate our operational metrics with the timelines of our calibration activities. Engineering teams regularly log critical delivery metrics through systems like AWS CloudWatch, Datadog, or built-in dashboards in CI/CD platforms such as GitLab CI, Jenkins, or AWS CodePipeline. These tools provide objective data on throughput and stability, such as deploy frequency, lead time for changes, and change failure rate. The intent here is to surface periods where engineering focus demonstrably shifted, impacting our ability to deliver. For instance, if lead time for changes consistently spikes during the weeks immediately preceding and during a calibration cycle, it strongly suggests a systemic drag on velocity. This isn't about blaming individuals, but identifying process-level inefficiencies that drain collective productivity. Furthermore, relying solely on quantitative data can sometimes miss the qualitative nuances of disruption. Calibration often requires managers and senior engineers to step away from active development, architecture reviews, or direct team support to prepare and defend assessments. Understanding these qualitative impacts, even when DORA metrics appear stable, is crucial for a complete picture. It helps us understand the type of disruption, not just its existence. Therefore, to prepare for a productive discussion next week and build a clear case for targeted process improvements, I propose we take a very specific, data-driven action. This isn't a speculative exercise; it’s about grounding our future strategy in evidence gleaned directly from our operational rhythm. Your concrete action for this week: Schedule a 30-minute review with your engineering leads and technical program managers by Friday. For this meeting, each lead should bring two specific data points: (1) their team's average weekly deploy frequency and lead time for changes from their respective CI/CD system (e.g., GitLab CI, AWS CodePipeline, Jenkins) for the last three months, with clear annotations marking any weeks that coincided with formal performance calibration activities; and (2) a concise, 2-3 sentence summary detailing one specific instance where current calibration activities significantly diverted engineering resources from critical path delivery or impacted team morale negatively during this period. Figures cited are from publicly available sources as of 2026-09-15 and may have changed. |