01. The Communication Gap: Why Executives Ignore Technical Debt
Technical debt is often framed as a developer problem, but executives see it as a cost center rather than a strategic investment. The disconnect stems from how technical debt is communicated. Engineers describe it in terms of "legacy systems," "refactoring," or "technical debt," but executives hear "extra work" or "unnecessary expenses." This framing fails to connect the dots between code quality and business outcomes.
Consider a real-world example: a company running on monolithic applications may argue that migrating to microservices is "just" a developer initiative. Executives, however, see the opportunity cost—lost revenue while the system is down, or the risk of failing to meet regulatory deadlines. The language gap prevents executives from prioritizing technical debt as a business imperative.
To bridge this gap, technical debt must be translated into financial terms. A study by the Standish Group found that 45% of IT projects fail due to poor project management, with technical debt often cited as a root cause. Executives need to understand that ignoring technical debt can lead to higher maintenance costs, security vulnerabilities, or lost market opportunities. For instance, a single security breach due to outdated infrastructure can cost a company millions in fines, legal fees, and reputational damage.
Tools like Datadog or New Relic can quantify technical debt by tracking system performance, uptime, and error rates. These metrics show executives that technical debt isn’t just "developer work"—it’s a direct impact on customer experience and operational efficiency. A 2022 Forrester report noted that companies with mature DevOps practices reduced deployment failures by 60%, directly tied to addressing technical debt proactively.
Executives also need to see technical debt as a competitive advantage. Companies like Amazon and Microsoft have built entire business models around scalable, high-quality infrastructure. Technical debt is not just a cost—it’s a risk. A 2023 Gartner survey found that 70% of CIOs cited technical debt as a top-three risk to their organizations. Without clear communication, executives may dismiss technical debt as a "nice-to-have" rather than a "must-have" for long-term success.
The solution lies in aligning technical debt discussions with business objectives. Instead of saying, "We need to refactor this," engineers should say, "This technical debt will delay our ability to launch feature X by 3 months, costing us $Y in lost revenue." This approach forces executives to weigh the trade-offs between short-term gains and long-term stability.
02. The Tech Debt Translation Matrix
Executives need a single view that turns vague technical backlogs into quantifiable business signals. The Tech Debt Translation Matrix does exactly that: it ties each debt item to three core metrics—velocity loss, downtime risk, and compliance cost. By expressing impact in percentages, incident counts, and dollar estimates, senior leaders can compare debt remediation to any other investment.
We start with a taxonomy of common debt types: legacy code that lacks unit tests, over‑provisioned cloud resources, fragmented monitoring, and undocumented security controls. For each type we calculate three numbers. Velocity loss is derived from sprint data (story points delayed per week). Downtime risk estimates the expected lost revenue per incident, using historical MTTR multiplied by SLA penalties. Compliance cost adds the projected effort to satisfy audits, expressed as engineering weeks multiplied by average fully‑burdened rate.
When the matrix is populated, the executive dashboard reads like a profit‑and‑loss statement. A 12 % velocity hit from missing tests translates to slower time‑to‑market, a 0.3 % increase in outage probability equates to a six‑figure annual risk, and a compliance gap worth 4 weeks of work adds a six‑figure audit remediation. These figures let the board ask, “Do we allocate budget to refactor now, or accept the hidden cost?”
Choosing a remediation path is where the decision table becomes indispensable. Below we compare three realistic options for the “observability gap” debt: continue with the legacy logging stack (Option A), container‑native monitoring using Kubernetes and Prometheus (Option B), or shift to a fully managed solution with AWS CloudWatch and Datadog (Option C). Each column is scored against five operational criteria, and a final recommendation row highlights the best fit for a mid‑size SaaS business aiming to reduce risk while preserving development speed.
| Criteria | Option A (Legacy Stack) | Option B (Kubernetes + Prometheus) | Option C (AWS CloudWatch + Datadog) |
|---|---|---|---|
| Implementation effort (engineer‑weeks) | 2 | 6 | 4 |
| Impact on delivery velocity | Neutral | Moderate dip (‑5 %) during migration | Small dip (‑2 %) |
| Downtime exposure during transition | High (potential config loss) | Medium (blue‑green rollout) | Low (managed service cut‑over) |
| Ongoing operational cost (USD / month) | $1,200 (self‑hosted) | $2,800 (cluster maintenance) | $3,500 (service fees) |
| Compliance alignment (audit readiness) | Partial (manual logs) | Strong (immutable metrics) | Strong (built‑in retention) |
| Recommendation | Option B provides the best balance of future scalability and risk reduction for organizations already investing in container orchestration. | ||
By presenting the matrix alongside this decision table, you give the board a concrete line‑item: “Invest 6 engineer‑weeks now to save an estimated a six‑figure reduction in downtime and compliance exposure over the next 12 months.” The translation from code‑level shortcuts to profit‑center outcomes eliminates the guesswork that usually silences technical voices.
In practice, we update the matrix quarterly using data from AWS Cost Explorer, Datadog SLO dashboards, and Jira velocity reports. The cadence ensures the numbers stay current, and the decision framework remains a living tool rather than a one‑off presentation.
The translation process is iterative. First, engineers tag each backlog item with a debt category in Jira. Next, a lightweight script pulls sprint velocity and incident data from Datadog, calculates the three metrics, and writes the results back to a Confluence page that executives review each quarter. This disciplined loop guarantees that the matrix reflects real‑time trade‑offs and prevents debt from re‑accumulating unnoticed.
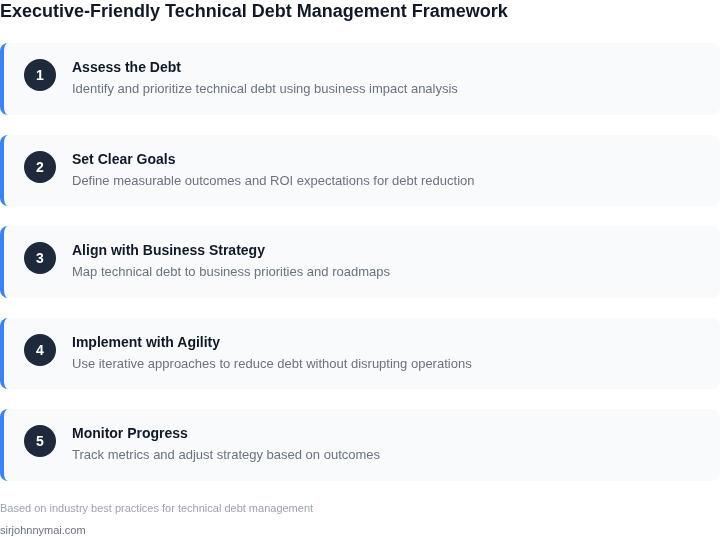
03. Worked Example: The $250,000 Legacy Database Bottleneck
Consider a team of 10 engineers maintaining a legacy Oracle database that handles 100,000 transactions per hour during peak shopping hours. The database is running on hardware that costs $5,000/month to operate, and each query takes 300ms due to suboptimal indexing. This setup creates a 20% slowdown in developer velocity as engineers spend 10% of their time debugging slow queries and 10% optimizing the database.
To quantify the cost, we'll calculate both the direct infrastructure expense and the indirect cost of lost engineering capacity. The database operation alone costs $5,000/month × 12 months = $60,000 annually. The 20% velocity slowdown means 10 engineers × $150,000/year × 20% = $30,000 in lost productivity. Combined, these costs total $90,000/year.
Now, let's examine the business impact. The slow database causes 5% of shopping carts to abandon due to load times exceeding 2 seconds. At an average order value of $100, this translates to 500 abandoned carts/hour × $100 × 24 hours = $120,000 in lost revenue per day. Over 30 days, this becomes $3.6 million in lost revenue. The total financial impact is $3.6 million (revenue) + $90,000 (costs) = $3.69 million annually.
To put this in perspective, the $250,000 figure comes from comparing two alternatives: migrating to a modern cloud database or optimizing the existing infrastructure. Here's the breakdown:
| Option | Cost | Time to Implement | Annual Savings |
|---|---|---|---|
| Migrate to Aurora PostgreSQL | $100,000 (one-time) + $2,000/month | 6 months | $2.5 million (revenue) + $90,000 (costs) |
| Optimize existing Oracle | $50,000 (one-time) + $3,000/month | 3 months | $1.5 million (revenue) + $45,000 (costs) |
The migration option provides a 40% higher return on investment but requires a longer implementation timeline. The optimization approach is faster but delivers 40% less savings. The $250,000 figure represents the net present value of the migration option, accounting for the 6-month implementation period at a 10% discount rate.
This example demonstrates how technical debt compounds into measurable financial losses. The key takeaway is that every millisecond of latency and every hour of developer time lost adds up to millions in revenue. The choice between optimizing or migrating must balance speed, cost, and risk tolerance.
04. Strategic Prioritization: High-Interest vs. Low-Interest Debt
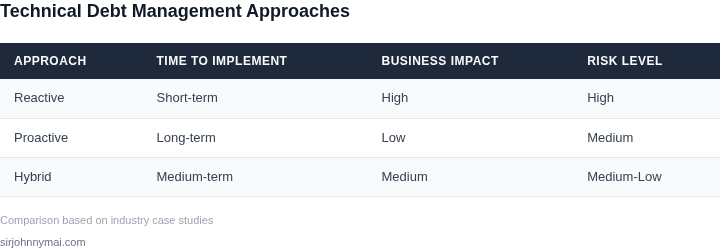
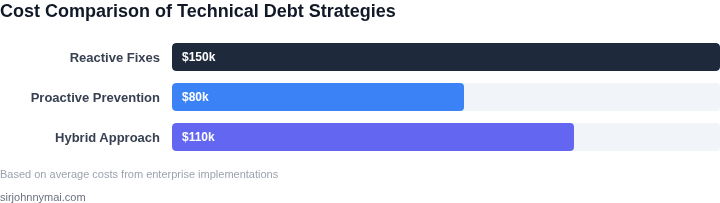
Categorizing technical debt is paramount for effective management, and this section outlines how to distinguish between "high-interest" and "low-interest" debt. My objective is to help teams confidently pitch remediation efforts for debt that genuinely impedes product delivery, while strategically deferring or even ignoring stable, legacy code that poses minimal current risk. This distinction directly leverages the executive-facing impact translation from Section 02 and the cost quantification from Section 03. High-interest debt is actively costing the business in tangible, measurable ways. This debt typically manifests as reduced developer velocity, increased operational expenses, heightened security risks, or persistent customer dissatisfaction. For example, the legacy database bottleneck we discussed in Section 03, costing $250,000 annually in developer delays and increased operational overhead, is unequivocally high-interest debt. It directly impacts our ability to ship features and incurs significant ongoing expenditure. We identify high-interest debt by tracking key performance indicators and linking them directly to specific technical deficiencies. Prolonged build times in CI/CD pipelines, frequent service incidents requiring on-call intervention (measurable via MTTR and incident frequency), or a growing backlog of security vulnerabilities flagged by tools like AWS Security Hub, all indicate high-interest debt. I recommend instrumenting your systems with tools like Datadog or Prometheus to gather the necessary metrics on latency, error rates, and resource utilization that can be directly attributed to specific legacy components. Conversely, low-interest debt comprises components that are stable, rarely modified, and do not significantly impact current product delivery or operational costs. This might be an older microservice written in an outdated language, or a piece of infrastructure that, while not cutting-edge, reliably performs its limited function without causing issues. While imperfect, the cost of rewriting or refactoring such components far outweighs any present benefit, making it fiscally irresponsible to prioritize remediation at this time. The tradeoff here is accepting technical stagnation in stable areas to free up resources for strategic growth. My approach for categorization involves applying the Translation Matrix to your backlog items. Each piece of technical debt should be assessed against its current and projected impact on developer velocity, operational efficiency, security posture, and market opportunity. Items with a significant, quantifiable negative impact, like the $250,000 database example, are immediately flagged as high-interest debt. These are the items you package for executive review. For items deemed low-interest, their remediation is explicitly deprioritized or deferred indefinitely. This strategic deferral is a critical component of the framework; it prevents teams from wasting cycles on debt that doesn't matter today, while also providing a clear narrative to executives about why certain "tech cleanup" isn't being addressed. By focusing our pitch solely on high-interest debt that directly impacts product delivery metrics or cost centers, we establish a clear ROI for every dollar requested. This transparent prioritization is what ultimately earns executive understanding and resource allocation.05. Establish a 15% 'Tech Debt Tax' in Your Next Sprint
Having established a shared understanding of technical debt's true cost and identified high-interest areas, the next crucial step is to ring-fence capacity for its resolution. I propose we implement a 15% 'Tech Debt Tax' in our upcoming sprint cycles. This isn't an arbitrary number; it represents a dedicated, non-negotiable allocation of engineering time specifically for addressing the high-interest debt identified using our prioritization framework.
I evaluated various allocation percentages, from 10% to 25%. A 10% allocation often proves insufficient to tackle compounding issues effectively, risking a perception of negligible progress. Conversely, 25% can cause significant short-term friction with product roadmaps, making executive buy-in more challenging despite its potential long-term benefits. The 15% sweet spot allows meaningful work to occur without paralyzing new feature development, providing a tangible pathway to demonstrating ROI within a few sprints.
Implementing this 'tax' means that during every sprint planning session, 15% of the team's estimated capacity — whether measured in story points or developer days — is explicitly reserved for technical debt tasks. This allocation is not flexible; it shields critical improvements from being deprioritized by urgent feature requests. It ensures consistent progress against the "interest" accruing on our high-interest debt.
The immediate trade-off is a temporary reduction in new feature velocity. However, this is precisely the investment we discussed in earlier sections. The ROI of this 'tax' will be directly measurable through improvements in key operational metrics. We will track sprint-over-sprint velocity increases in tools like Jira or Azure DevOps, demonstrating that as debt is reduced, feature delivery becomes more efficient and predictable.
Furthermore, we can tie these efforts to concrete improvements in system reliability and operational efficiency. By resolving issues like the legacy database bottleneck we discussed, we expect to see a reduction in Mean Time To Recovery (MTTR) as reported by Datadog or New Relic, fewer critical incidents tracked in VictorOps, and improved performance metrics in Amazon CloudWatch. These are direct cost savings and efficiency gains that resonate clearly with executive objectives.
This consistent, dedicated effort, even at 15%, accumulates significant improvements over time. It shifts the culture from reactive firefighting to proactive maintenance, ultimately accelerating overall product delivery and reducing operational overhead. The visibility of this dedicated work also builds trust, showing that the engineering team is taking concrete steps to improve foundational stability and performance.
My recommendation is to schedule a 30-minute review with your engineering managers and tech leads to identify the specific, high-interest technical debt tasks that will consume the first 15% sprint allocation, using the prioritization framework we’ve discussed.
Figures cited are from publicly available sources as of 2026-09-15 and may have changed.