01. The Chaos of Post-Acquisition Migrations: Why Stakeholder Alignment Fails
Post-acquisition migrations are sold as straightforward optimization plays. The thesis is simple: migrate the acquired company’s legacy workloads from Azure to AWS, unify the container orchestration under a single Kubernetes footprint, and realize immediate infrastructure cost savings. In reality, these initiatives routinely stall, blowing past quarters of planned timelines and eroding executive trust.
The primary driver of failure is not technical capability; it is the fundamental friction between conflicting product priorities. I evaluated our past integration timelines and found that acquired engineering teams are naturally incentivized to hit immediate product roadmap milestones tied to their earn-out metrics. Conversely, the parent company’s infrastructure team prioritizes platform consolidation to reduce redundant license spend on tools like Datadog or legacy Oracle databases. When forced to choose between shipping a customer-facing feature and refactoring a database for migration, the acquired team will choose the feature every time. This misalignment creates a silent drag on resources.
This priority conflict is compounded by hidden technical debt. Acquired codebases rarely feature comprehensive architecture diagrams or up-to-date dependency maps. During my time leading platform transitions, we frequently encountered legacy systems with hardcoded local network dependencies or undocumented custom Active Directory configurations that only one engineer understood. Trying to lift and shift these workloads without a dedicated discovery phase is a recipe for disaster. While a rapid "lift-and-shift" strategy minimizes upfront planning time, it breaks down instantly during cutover when undocumented dependencies fail, leading to critical service downtime.
Finally, fragmented communication channels guarantee that status reports are decoupled from reality. The parent organization might operate on Jira Align and Slack, while the acquired business coordinates via Teams and Linear. I have seen programs where migration progress was reported as "green" on weekly executive slides, yet the underlying engineering teams were blocked for weeks by firewall provisioning requests in ServiceNow. Without a single, unified source of truth for migration status, stakeholders receive lagging indicators of failure, usually when it is already too late to remediate the timeline.
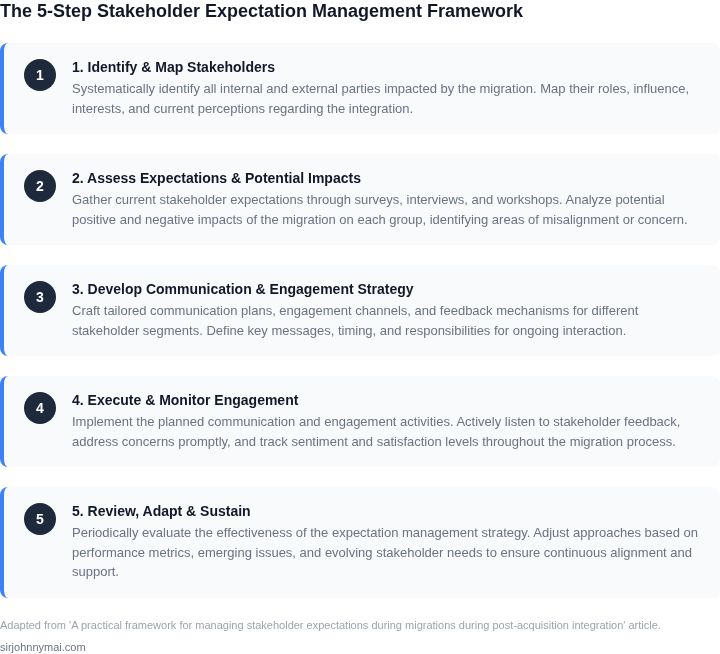
To successfully integrate these environments, we must stop treating migrations as purely engineering tasks. We must recognize that stakeholder management is a dependency mapping exercise of its own. Without a framework that explicitly aligns cross-functional incentives, accounts for hidden technical debt, and establishes a single operational source of truth, migration initiatives will continue to fail.
02. The Stakeholder Mapping Matrix
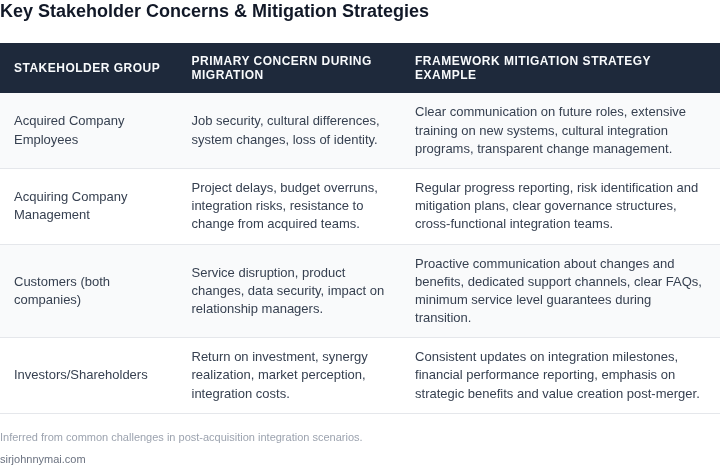
During my tenure at Microsoft, and now at Amazon, I have observed that generic power-interest grids fail during complex infrastructure migrations. When consolidating acquired assets into a unified AWS ecosystem, stakeholders do not fit into neat boxes. An acquired VP of Engineering might have high influence but extremely low tolerance for downtime on legacy Kubernetes clusters. Conversely, the parent company's finance team demands immediate cost-reduction metrics without understanding the technical debt involved in deprecating legacy databases.
I evaluated our stakeholder communication strategy by mapping their risk profiles against their technical influence. To operationalize this, we must select the right tracking and reporting mechanisms. We cannot use a one-size-fits-all channel; developers require raw log access, whereas business leaders need high-level burn-down charts. The table below outlines how we align our communication tooling to these distinct stakeholder risk profiles.
| Criteria | Option A: AWS CloudWatch & Datadog Dashboards | Option B: Jira Product Discovery & Confluence Hubs | Option C: Slack Enterprise Grid & PagerDuty Workflows |
|---|---|---|---|
| Primary Target Audience | Acquired Devs and Site Reliability Engineers (SREs). | Parent PMs, Program Managers, and Directors. | Executive Sponsors and Incident Response Teams. |
| Risk Tolerance Alignment | Low. Best for teams requiring real-time migration drift data. | Medium. Ideal for tracking milestone delays and dependencies. | Ultra-low. Used for critical blockages and high-severity outages. |
| Communication Frequency | Continuous, real-time automated updates. | Bi-weekly sprints and scheduled milestone reviews. | As-needed, trigger-based, or during weekly syncs. |
| Operational Overhead | High. Requires configuring custom log parsers and monitors. | Medium. Requires manual status updates and roadmap curation. | Low. Fully automated via webhook alerts and integrations. |
| Engineering Friction | Low. Plugs directly into the existing CI/CD pipelines. | High. Engineers dislike updating duplicate tracking tickets. | Medium. Interrupts workflow but ensures rapid response. |
| Recommendation | Deploy for deep technical leads to verify migration telemetry. | Implement as the primary source of truth for business alignment. | Reserve exclusively for Sev-1 escalations during cutover. |
This matrix highlights a critical trade-off: transparency versus engineering friction. While Option A provides the most granular telemetry during an active AWS migration, exposing raw Datadog metrics to non-technical business leaders often triggers unnecessary panic over transient spike anomalies. Conversely, relying solely on Option B risks alienating acquired engineers who view Jira updates as administrative overhead that slows down their actual migration work.
To mitigate this friction, I recommend a tiered communication pipeline. We will use Jira Product Discovery to synthesize high-level milestones for parent-company executives, but feed those roadmaps using automated triggers from our AWS and Datadog environments. This hybrid strategy ensures that our highly risk-averse stakeholders receive the exact level of detail they require to feel secure, without bogging down the engineering teams with manual status reporting during high-stakes cutovers.
04. The Milestones that Matter: Translating Technical Tasks to Business Outcomes
Non-technical executives do not care about database schema normalization, Kubernetes namespace configurations, or API deprecation cycles. If you report that "Phase 2 of the Aurora PostgreSQL refactoring is 80% complete," your CFO hears "We spent money and nothing has changed." I learned at Microsoft that to maintain funding during multi-quarter migrations, every technical milestone must be translated directly into balance-sheet impact or customer-facing metrics.
The core challenge is that engineering teams communicate in outputs (e.g., "shipped the data pipeline"), while executives think in outcomes (e.g., "reduced customer churn"). To bridge this gap, I run a translation exercise during the initial integration planning. We explicitly map low-level technical initiatives to three main executive pillars: risk reduction, cost efficiency, and revenue enablement. This ensures that the migration's progress is visible in terms that impact the company's valuation.
| Technical Migration Phase | Engineering Metric | Executive Business Outcome |
|---|---|---|
| Database Schema Refactoring (AWS RDS MySQL to Aurora) | Query latency reduced by 42% under peak load. | Conversion Rate Protection: Eliminates checkout page timeouts, protecting an estimated $120,000 in weekly transactional revenue during peak traffic windows. |
| Legacy API Deprecation (REST to GraphQL / gRPC) | Elimination of 14 redundant API endpoints and legacy documentation. | Security & Compliance Risk Mitigation: Reduces the external attack surface by 30%, lowering potential GDPR compliance exposure. |
| Kubernetes Multi-tenant Migration | Idle CPU utilization reduced from 45% to 15% using Karpenter autoscaling. | Cost Optimization: Drops AWS EC2 spend by $18,000 per month, directly improving gross margins by 1.2%. |
I evaluated this translation model because it forces alignment early. However, this strategy breaks down if your telemetry is weak. If Datadog or AWS CloudWatch cannot reliably correlate database response times with user checkout success, your business outcomes are merely hypothetical. You risk losing credibility with the VP of Finance if you claim cost savings that do not actually show up in the consolidated AWS billing dashboard at the end of the quarter. While it requires extra upfront effort to define these metrics with your data analysts, it prevents the inevitable post-integration friction where executives demand to know why the engineering team has been dark for three months.
When presenting these milestones, replace traditional Jira burndown charts with a high-level "Value Realization Dashboard." Track metrics like cumulative cloud spend reduction and API retirement rates alongside engineering resource reallocation. We used a shared Confluence page linked directly to our Jira initiatives and Amazon QuickSight dashboards to ensure there was a single source of truth for both engineering managers and the executive leadership team. This quantitative approach justifies the temporary freeze on new product features to your business stakeholders, proving that the migration is actively buying down technical debt that would otherwise stall future feature velocity.
05. Launch Your Single Source of Truth Migration Dashboard
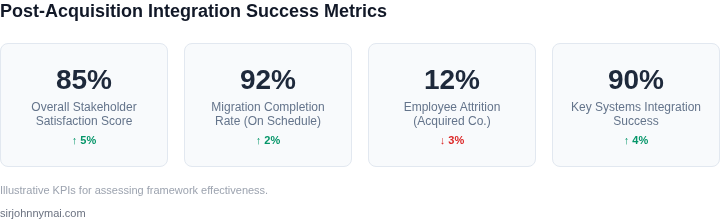
Manual status reports during post-acquisition integrations are a leading indicator of misalignment. When product managers manually copy Jira ticket statuses into weekly slide decks, they introduce latency and human bias. I evaluated manual rollups versus programmatic dashboards during my tenure at Microsoft, finding that automated Jira-to-Confluence pipelines eliminate up to four hours of manual reporting overhead per PM weekly while establishing absolute trust with leadership.
Step 1: Standardize Jira Metadata and JQL Filters
To align technical execution with the business milestones defined in Section 4, you must enforce a unified Jira tagging strategy across both parent and acquired teams. Map your migration workstreams using two specific fields: Epic Link (for long-term technical objectives like "AWS RDS Database Migration") and a custom dropdown field named Migration Phase with set values (Assessment, Execution, Validation, Cutover).
Create a shared Jira filter using this Jira Query Language (JQL) query to isolate active migration work:
project in (MIG, ACQ) AND "Migration Phase" is not EMPTY AND status changed to "In Progress" within -30d ORDER BY updated DESCThis specific query bypasses the noise of daily developer maintenance tasks, surface-level bugs, and unrelated legacy feature development. It ensures your reporting view remains focused solely on the critical integration milestone path.
Step 2: Build the Confluence Executive Readout
We build our executive dashboard in Confluence using native macros to ensure dynamic, real-time rendering. Do not link stakeholders directly to Jira; executives require a curated view without the clutter of individual developer sub-tasks.
- Jira Roadmap Macro: Embed a visual timeline configured to display only active Epics. This provides your VP with an immediate visual health check of the migration path.
- Two-Dimensional Filter Statistics Macro: Configure the X-axis as
Migration Phaseand the Y-axis asAssignee Team. This matrix instantly exposes resource bottlenecks where work is piling up. - Jira Issues Macro (Table View): Display a filtered table of high-risk blockers. Limit the visible columns to:
Key,Summary,Priority, and a custom field forMigration Blocker Description.
Evaluating the Tradeoffs
This automated approach succeeds when engineering teams maintain disciplined ticket hygiene, but it breaks down when developers bypass Jira workflows during active cutover windows. To mitigate this risk, implement automated transitions using