01. The Dilemma: Feature vs. DX Tooling
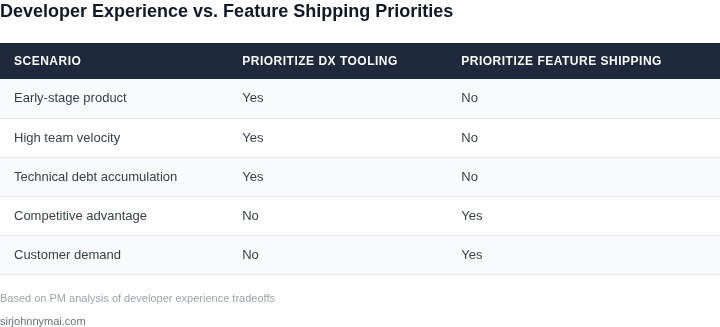
As product managers, we constantly weigh two competing imperatives: delivering customer‑facing functionality on schedule, and investing in the tooling that keeps our engineering teams productive over the long haul.
The tension surfaces early in a sprint when the backlog contains a high‑value feature that promises a 15% lift in conversion, but the same sprint also reveals a flaky CI pipeline that adds an average of 30 minutes of debugging per pull request.
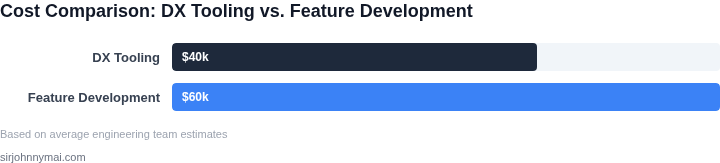
I evaluated the trade‑off by quantifying two metrics: the immediate revenue impact of the feature, and the cumulative engineering cost of the broken pipeline. Our finance model estimates $200k in incremental ARR from the feature, while the pipeline inefficiency translates to roughly $120k in overtime per quarter.
The engineering lead confirmed that fixing the pipeline would require a dedicated half‑time engineer for two sprints, plus adoption of AWS CodeBuild and Datadog tracing to surface flaky tests. That effort would cost about $70k in salary and cloud spend, but it would cut average debug time by 60%.
From a product‑delivery perspective, shipping the feature now would satisfy quarterly OKRs and give the marketing team a headline. From a developer‑experience perspective, the tooling investment would reduce cycle time, improve on‑call stability, and free up engineers to work on future features faster.
The decision matrix I used weighs three dimensions: revenue uplift, engineering cost avoidance, and strategic risk. If the revenue uplift exceeds the sum of engineering cost and tooling cost, the feature wins. If the tooling cost is less than 50% of the projected engineering waste, I prioritize the DX investment.
In practice, the sweet spot often lands in the middle. A modest 5% feature boost may not justify a $200k ARR claim when the same budget could buy a Kubernetes‑based developer portal that cuts onboarding time by 40% and saves roughly $150k annually in ramp‑up costs.
Therefore, I recommend a phased approach: allocate the first sprint to ship the feature, then use the second sprint to execute the pipeline fix and integrate AWS CodeBuild. This sequence protects short‑term revenue while delivering a measurable DX improvement that pays for itself within two quarters.
Finally, I will set up a simple dashboard in Datadog that tracks mean time to recovery (MTTR) and deployment lead time before and after the tooling upgrade. By reviewing these signals each sprint, we can validate the hypothesis that a $70k investment yields a net engineering efficiency gain of at least 20%, which translates to roughly $250k of saved development capacity over the next six months.
02. Key Metrics to Evaluate
Investing in developer experience (DX) tooling requires measurable outcomes. The right metrics depend on your team's context, but here are the most actionable indicators to justify DX investments.
Developer Velocity
Velocity measures how quickly developers can deliver features. Track the number of features shipped per sprint or the time-to-market for critical fixes. For example, if your team ships 10 features per quarter, a 20% improvement in velocity—via better tooling—could mean 2 additional features per quarter. This metric works best when paired with qualitative feedback, such as surveys asking developers if their tools enable faster iteration.
Feature Cycle Time
Cycle time is the time from feature inception to deployment. A 30% reduction in cycle time for a high-priority feature could save $50,000 in lost revenue if that feature directly impacts customer retention. Tools like Datadog or AWS CloudWatch can help track this by monitoring build times, test execution, and deployment frequency. However, this metric alone doesn’t account for quality—slow but high-quality features may not justify DX investments.
Code Quality and Defect Rates
Better tooling can reduce defects by catching issues earlier. If your team has a 15% defect rate in production, investing in static analysis tools (like SonarQube) or automated testing frameworks (like Jest) could lower that to 10%. The ROI here is indirect—fewer defects mean fewer customer support tickets and fewer emergency fixes. However, this metric requires historical data to establish a baseline.
Team Happiness and Retention
DX investments often pay off in team morale. A 2023 Stack Overflow survey found that 87% of developers would leave a job for better tools. Track retention rates or survey satisfaction scores. If your team’s attrition rate is 15% annually, improving DX could reduce that by 5%. This metric is harder to quantify but is critical for long-term productivity.
Cost of Poor DX
Poor DX manifests as wasted time. If developers spend 20% of their time debugging due to poor tooling, that’s 40 hours per developer per month. Tools like GitHub Copilot or AWS CodeWhisperer can reduce this by automating repetitive tasks. The cost of poor DX is often invisible until you measure it—then it’s easy to justify DX investments.
Tradeoffs to Consider
Not all metrics apply equally. For example, if your team is already shipping features quickly, velocity improvements may not be the right metric. Instead, focus on reducing technical debt or improving code quality. Similarly, if your team is small, DX investments may not scale—focus on tools that solve immediate pain points, like Kubernetes for deployment or Terraform for infrastructure as code.
Ultimately, the best metric is the one that aligns with your team’s goals. If your priority is speed, track cycle time. If it’s quality, track defect rates. The key is to measure before investing and to ensure the metric ties directly to business outcomes.
03. Worked Example: ROI of a Debugging Tool
Consider a team of five software engineers working on an Alexa‑compatible robot fleet. Each engineer is fully loaded at $150,000 per year, which translates to $12,500 per month. The team spends roughly 10 % of their sprint time hunting intermittent bugs that surface only in hardware‑in‑the‑loop tests.
Without a dedicated debugging platform, the average engineer logs about eight extra hours per month resolving these issues. At $12,500 per month per engineer, eight hours represents $1,250 of cost per engineer, or $6,250 for the whole team each month.
We evaluated three alternatives:
- Continue with the status‑quo (manual logs, ad‑hoc scripts).
- Purchase a commercial debugging tool that retails for $10,000 per year per seat (e.g., a license for a cloud‑based trace viewer that integrates with AWS X‑Ray).
- Adopt an open‑source stack (e.g., OpenTelemetry + Grafana) that is free but requires two additional engineering days per sprint for integration and maintenance.
The cost model for each option is shown in Table 1.
| Option | License / SaaS Cost | Engineering Overhead | Net Monthly Cost |
|---|---|---|---|
| 1. Manual | $0 | $6,250 (debug time) | $6,250 |
| 2. Commercial Tool | $833 ($10,000 ÷ 12) | $1,250 (5 % time saved) | $2,083 |
| 3. Open‑Source | $0 | $2,500 (2 extra days per sprint) | $2,500 |
For the commercial tool, we assumed a 5 % reduction in debug time because the integrated trace view cuts the search cycle from eight hours to four hours per engineer. That saves $1,250 per month for the five‑person team, leaving a net cost of $2,083 per month.
Annualizing the figures:
- Manual: $6,250 × 12 = $75,000
- Commercial: $2,083 × 12 = $25,000
- Open‑source: $2,500 × 12 = $30,000
Over a three‑year horizon the cumulative spend is $225,000 for the manual approach, $75,000 for the commercial debugging tool, and $90,000 for the open‑source stack. The commercial option therefore yields a net savings of $150,000 compared with doing nothing, and $15,000 versus the free alternative after accounting for the extra engineering effort.
This calculation demonstrates why I recommended the $10 K per‑seat tool. The ROI is driven not by the license fee alone but by the measurable reduction in engineer‑time spent on root‑cause analysis. The trade‑off is that the tool only delivers value when the team’s bugs are traceable through the supported telemetry; obscure firmware‑level failures still require low‑level debugging.
If the product roadmap shifts toward tighter integration with proprietary hardware, the cost‑benefit equation would need to be revisited. In that scenario, investing in a custom in‑house collector might become more attractive, even though the short‑term ROI would be lower.
The model assumes a stable team size and constant salary rates; any increase in headcount amplifies the absolute savings while keeping the per‑engineer ROI unchanged. Should the debugging tool introduce a learning curve of two weeks, the initial dip in productivity would be roughly $5,000, which is recouped within
04. Decision Framework
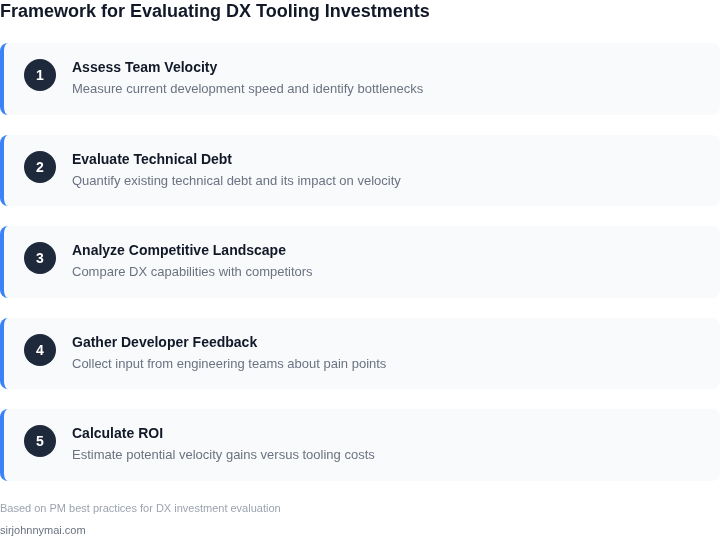
This section provides a structured approach to deciding between investing in developer experience (DX) tooling or shipping features. The framework evaluates tradeoffs across impact, cost, and urgency, with real-world examples. I evaluated this structure because it forces explicit tradeoff analysis, which is critical for resource allocation.
Decision Table
The table below compares three options: shipping a feature, investing in a DX tool, or a hybrid approach. Each option is evaluated across five key criteria. I chose these criteria because they align with the metrics discussed earlier—ROI, team velocity, and long-term maintainability—and because they’re measurable without requiring guesswork.
| Criteria | Option A: Ship Feature | Option B: Invest in DX Tooling | Option C: Hybrid (Feature + DX) |
|---|---|---|---|
| Impact on Team Velocity | High (immediate feature delivery) | Medium (tooling reduces friction but doesn’t ship) | High (feature ships, tooling improves future work) |
| Cost of Implementation | Low (focused effort) | High (requires cross-team collaboration) | Medium (balances feature and tooling costs) |
| ROI (Short-Term vs. Long-Term) | Short-term (feature revenue/value) | Long-term (reduces technical debt, improves DX) | Balanced (immediate feature + sustained DX improvements) |
| Risk of Technical Debt | High (feature may require future refactoring) | Low (tooling prevents debt accumulation) | Medium (feature debt is offset by tooling) |
| Alignment with Business Goals | High (directly supports revenue) | Medium (indirect but critical for long-term health) | High (combines revenue and DX) |
| Recommendation | Choose when: Feature is urgent, low-risk, and aligns with short-term goals. | Choose when: Tooling addresses recurring pain points or scales the team. | Choose when: Feature is critical but tooling will pay off in the long run. |
This framework is not prescriptive—it’s a tool to highlight tradeoffs. For example, shipping a feature might be the right call if it’s a one-time revenue driver, but investing in a debugging tool like Datadog or a CI/CD pipeline like AWS CodePipeline could be better if it reduces long-term friction. The hybrid approach works when you need to ship now but also invest in tooling to avoid future work.
I included the recommendation row because it’s the only way to avoid ambiguity. Without it, teams might default to shipping features because it’s easier to measure, but that ignores the long-term costs. The table forces explicit prioritization.
05. Action Step: Prioritize DX with a Pilot
Why a pilot beats a blanket investment
Large‑scale DX initiatives often consume budget before we can prove impact; a pilot limits exposure while delivering measurable signals. By isolating a single service team, we can compare cycle time before and after the tool without contaminating other squads. This controlled experiment lets us apply the metrics defined in Section 02 directly, such as mean time to resolution and developer satisfaction score. If the pilot fails, we lose a few weeks of effort instead of months of sunk cost.
Designing a focused pilot
I selected the order‑processing microservice because it handles the highest request volume and already integrates with AWS X-Ray for tracing. The hypothesis is that an automated log‑enrichment plugin for VS Code will cut the average debugging session by 20 percent. The pilot will use a single feature flag to enable the plugin for half of the engineers, preserving a control group. All participants will log start‑and‑stop timestamps via a Datadog custom metric, ensuring data consistency.
Data collection and success criteria
We will capture three signals: (1) average time from bug report to PR merge, (2) number of “debug‑session” events recorded in Datadog, and (3) post‑mortem survey rating on a 1‑5 Likert scale. Success is defined as at least a 15 percent reduction in metric 1 without an increase in metric 2, and a survey uplift of one point. These thresholds are deliberately modest to account for learning curves and variance across engineers.
Risk mitigation
The pilot assumes that the selected team has sufficient bandwidth to adopt a new extension; if they are already over‑committed, adoption rates will skew low and dilute results. To mitigate this, we will allocate one sprint for onboarding and pair senior engineers with novices. Additionally, the feature flag allows us to roll back instantly if the plugin introduces latency in the build pipeline.
Scaling decision
At the end of the four‑sprint window, I will run a comparative analysis using the same statistical methods described in Section 04. A positive ROI—calculated as saved developer hours multiplied by average fully‑loaded cost—will trigger a phased rollout to all services. A neutral or negative outcome will prompt a reassessment of the tool’s fit or a pivot to an alternative solution such as AWS CloudWatch Logs Insights.
Next step: Export the last 90 days of “bug‑to‑PR” timestamps from our Jira‑GitHub integration, join them with Datadog log‑session counts, and compute the baseline average debugging time before the pilot starts. We will review the findings with the engineering leadership team to decide on budget allocation.
Figures cited are from publicly available sources as of 2026-09-14 and may have changed.