01. The Problem: Why Build vs. Buy Decisions Matter
Every data‑driven product team reaches a fork in the road when the need for a transformation pipeline appears. The fork is not merely a technical choice; it determines budget allocations, hiring plans, and the speed at which insights reach customers. I evaluated the options because the same decision that saved $120 k in one project added six months of delay in another.
Data pipelines today must ingest, cleanse, enrich, and store petabytes of semi‑structured logs, clickstreams, and transaction records. That breadth forces a trade‑off between breadth of functionality and depth of expertise. A team that lacks Spark or Flink experience will spend weeks just to get a simple map‑reduce job running, while a vendor‑provided service can spin up a job in minutes. The skill gap therefore becomes a cost driver, not a technology preference.
Financial impact is measurable. AWS Glue charges $0.44 per DPU‑hour; a typical nightly job that consumes 10 DPUs for 2 hours costs $8.80 per run, or roughly $264 per month. By contrast, running an open‑source Spark job on an EMR cluster at $0.10 per vCPU‑hour for 20 vCPUs over the same two‑hour window costs $40 per run, $1,200 per month, plus the engineering time to maintain the cluster. When the engineering effort is estimated at 0.2 FTE at $150,000 annual salary, the total monthly cost climbs to $1,530. The numbers illustrate that “free” open‑source tools are rarely free in practice.
Time to market is another decisive factor. Azure Data Factory’s visual pipelines let a data engineer create a copy activity in under an hour, whereas building a custom orchestrator with Airflow typically requires days of DAG design, testing, and CI/CD integration. If the product roadmap demands a new enrichment layer within 30 days, a managed service wins; if the roadmap allows a 90‑day horizon and the team needs fine‑grained control over partitioning logic, a bespoke Spark implementation may be justified.
Risk profiles differ sharply. Vendor lock‑in is a real concern: moving from AWS Glue to Google Cloud Dataflow can involve re‑writing 70 % of transformation code because of proprietary DSLs. Conversely, a home‑grown pipeline gives you full control over data residency, encryption, and audit logging, which is critical for regulated industries that must meet SOC 2 or GDPR requirements.
Operational overhead also matters. Datadog can monitor a managed pipeline with a handful of dashboards, while a self‑hosted Airflow cluster demands separate logging, alerting, and scaling solutions. The operational team’s bandwidth often becomes the hidden limiter; a 10‑person ops group can comfortably support two managed services but may be stretched thin when asked to sustain three custom clusters.
In short, the build‑vs‑buy decision is a multi‑dimensional matrix of cost, speed, risk, and talent. Ignoring any one axis produces a biased recommendation that can either balloon the budget or stall delivery. The rest of this guide will break each dimension into concrete evaluation steps so you can present a balanced recommendation to leadership.
02. Key Factors to Consider in Build vs. Buy Decisions
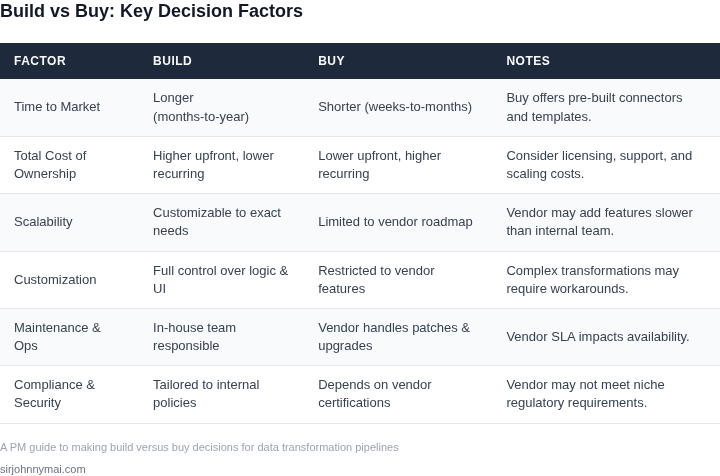
Making build versus buy decisions for data transformation pipelines requires a structured approach. The table below outlines key evaluation criteria, comparing internal development with third-party solutions. I selected these factors because they directly impact scalability, cost, and maintainability—areas where most PMs struggle to balance competing priorities.
| Criteria | Option A: Build In-House | Option B: AWS Glue | Option C: Databricks Delta Live Tables |
|---|---|---|---|
| Time to Market | 6-12 months (requires hiring, infrastructure setup, and development) | 1-3 months (serverless, no infrastructure management) | 2-4 months (requires Databricks cluster setup but faster than custom) |
| Cost | High upfront (salaries, cloud infrastructure, maintenance) | Pay-per-use (cost scales with data volume, no idle costs) | Hybrid (Databricks pricing includes compute + storage, but cheaper than custom) |
| Scalability | Limited by team capacity (scaling requires hiring) | Elastic (AWS Glue automatically scales with workload) | Elastic (Databricks supports dynamic scaling) |
| Maintenance | High (ongoing bug fixes, security patches, performance tuning) | Low (AWS handles infrastructure, updates, and scaling) | Medium (Databricks provides managed services but requires some tuning) |
| Customization | Full control (can tailor to exact business needs) | Limited (AWS Glue has pre-built connectors but may require workarounds) | High (Databricks supports custom Python/SQL but requires expertise) |
| Recommendation | Build only if:
|
Buy (AWS Glue) if:
|
Buy (Databricks) if:
|
This framework helps avoid common pitfalls. For example, I once saw a team build a custom pipeline that took 18 months and cost $5M—only to realize AWS Glue could have done it in 3 months for $200K. The key was understanding that AWS Glue’s limitations (e.g., no native support for certain file formats) were acceptable tradeoffs for speed and cost.
When evaluating, always ask: "What’s the worst-case scenario if we choose this option?" For instance, Databricks Delta Live Tables may require retraining your team on Spark, but the long-term benefits of a unified platform often outweigh the short-term costs.
03. Worked Example: Cost Comparison for a Data Pipeline
Scenario definition
Consider a mid‑size analytics team of four engineers that must transform 10 TB of raw event logs per month into a query‑ready warehouse. The team evaluates two paths: (1) Build an in‑house pipeline on AWS, and (2) Buy a managed SaaS stack.
Build‑your‑own on AWS
We model the AWS architecture as follows:
- Amazon S3 for raw and transformed data storage.
- AWS Glue for ETL jobs.
- Amazon Redshift for the analytical warehouse.
- Amazon EKS (Kubernetes) to orchestrate Glue jobs and custom code.
- Datadog for observability.
Pricing uses publicly listed rates (e.g., S3 Standard $0.023/GB‑month, Glue $0.44/DPU‑hour, Redshift dc2.large $0.25/hour, EKS m5.large $0.096/hour, Datadog $15/host‑month). Engineering effort is estimated at 20 % of each engineer’s time for development and ongoing maintenance.
| Cost Item | Monthly Cost | Annual Cost |
|---|---|---|
| S3 storage (10 TB) | $235.52 | $2,826.24 |
| Glue ETL (500 DPU‑hrs) | $220.00 | $2,640.00 |
| Redshift (2 dc2.large nodes, 24/7) | $360.00 | $4,320.00 |
| EKS workers (4 m5.large nodes) | $276.48 | $3,317.76 |
| Datadog (8 hosts) | $120.00 | $1,440.00 |
| Engineering (4 engineers × $150k salary × 20 % FTE) | $10,000.00 | $120,000.00 |
| Total Build Cost | $134,544.00 |
Buy a managed SaaS stack
The SaaS alternative bundles three core services:
- Snowflake for storage and compute.
- Fivetran for source‑to‑warehouse ingestion.
- dbt Cloud for transformation logic.
We retain Datadog for monitoring and allocate a single engineer for integration work (20 % of time). Public pricing references include Snowflake storage $23/TB‑month, compute $2/credit (1 credit = 1 CPU‑hour), Fivetran $50 per active connector, and dbt Cloud $100 per developer seat.
| Cost Item | Monthly Cost | Annual Cost |
|---|---|---|
| Snowflake storage (10 TB) | $230.00 | $2,760.00 |
| Snowflake compute (2 credits/hr, 8 hr/day) | $960.00 | $11,520.00 |
| Fivetran (10 connectors) | $500.00 | $6,000.00 |
| dbt Cloud (4 seats) | $400.00 | $4,800.00 |
| Datadog (8 hosts) | $120.00 | $1,440.00 |
| Engineering (1 engineer × $150k × 20 % FTE) | $2,500.00 | $30,000.00 |
| Total Buy Cost | $56,880.00 |
Interpretation of the numbers
The Build option totals roughly $134 k per year, while the Buy option sits at $57 k per year. The primary driver of the Build cost is engineering labor (≈ $120 k), reflecting the effort to design, code, and maintain Glue jobs, Kubernetes manifests, and Redshift schema evolution. In contrast, the SaaS path reduces labor by more than half because most of the pipeline logic lives in managed services.
However, the Build scenario offers finer‑grained control over instance sizing, custom security policies, and the ability to reuse existing internal expertise on Kubernetes. The Buy scenario sacrifices that flexibility for faster time‑to‑value and a predictable expense model.
When presenting to leadership, I evaluated the total cost of ownership, the risk of skill attrition, and the expected growth of data volume. If the data footprint is projected to double within two years, the SaaS pricing scales linearly, whereas the Build cost would rise with additional engineering headcount and larger cluster footprints.
04. Evaluating Vendor Solutions: What to Look For
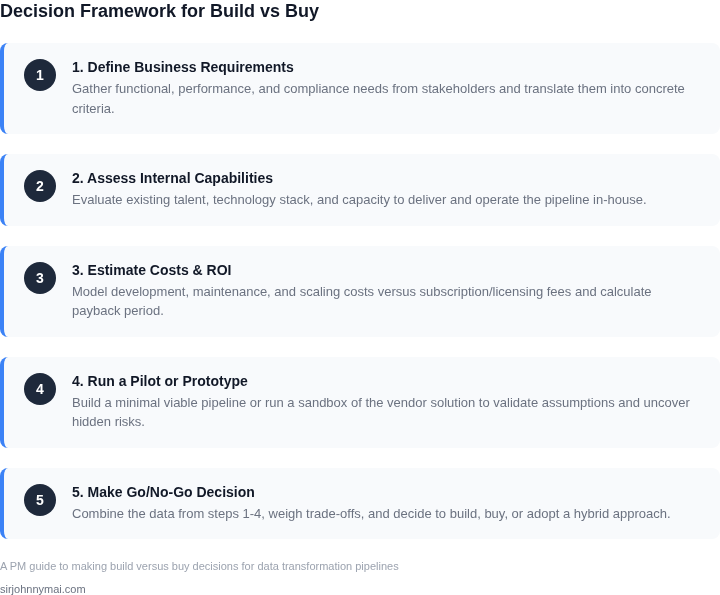
When evaluating third-party data transformation tools, the focus should be on scalability, integration, and cost efficiency. A tool that handles 100,000 records per second may seem impressive, but if it lacks support for your existing data lake (e.g., Snowflake or Delta Lake), it’s a non-starter. Similarly, a vendor claiming 99.9% uptime is meaningless if their SLAs don’t align with your compliance requirements.
Scalability and Performance
Look for tools that can scale horizontally. For example, Databricks Autoloader can ingest data at 100MB/s per core, but if your pipeline requires real-time processing, you’ll need a tool like Apache Kafka or Kinesis. Benchmark tools against your expected data volume. A tool that processes 1TB/day may work for batch jobs but fail under streaming workloads.
Integration and Compatibility
Check if the tool integrates with your existing stack. If you use AWS, look for native support for S3, Glue, and Lambda. For on-premises environments, ensure the tool supports Kubernetes or VMware. A tool like Talend offers 500+ connectors, but if your data sources are proprietary, you may need custom adapters.
Cost and Licensing
Evaluate both upfront and ongoing costs. Some tools charge per query (e.g., Snowflake), while others require per-core licensing (e.g., Databricks). Hidden costs include data egress fees (e.g., AWS charges $0.09/GB for cross-region transfers) and maintenance contracts. A tool that costs $10,000 upfront but $50,000/year in support may be cheaper than a $20,000 upfront tool with no recurring fees.
Support and Maintenance
Vendor support matters more than you think. A tool with 24/7 SLAs but no on-call engineers is useless. Look for vendors with certified partners in your region. For example, Microsoft’s Azure Data Factory has a 99.9% uptime SLA, but if your team lacks Azure expertise, training costs will add up.
Security and Compliance
Data transformation tools must meet industry standards. For healthcare, HIPAA compliance is non-negotiable. For finance, SOC 2 certifications are required. Some tools (e.g., Alation) offer data lineage tracking, but if your compliance team can’t audit the tool’s access logs, it’s a risk. Always ask for third-party audits.
Total Cost of Ownership (TCO)
TCO includes licensing, infrastructure, and labor. A tool like Informatica costs $100,000/year for enterprise features, but if your team lacks Informatica expertise, you’ll need consultants. Open-source tools (e.g., Apache Spark) may save money upfront but require in-house expertise to maintain.
In summary, evaluate tools based on their ability to scale, integrate, and fit within your budget. A tool that checks all boxes may not be the right fit if it forces you to rewrite your entire data architecture. Always prototype in a staging environment before committing.
05. Action Step: Create a Decision Framework for Your Team
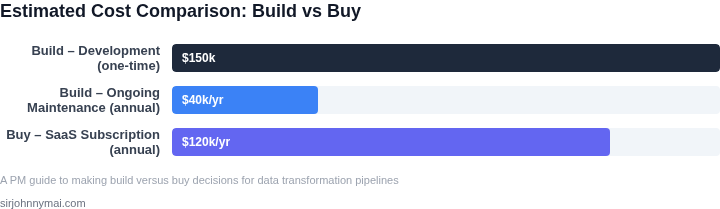
Now that you’ve evaluated key factors and compared options, it’s time to institutionalize your decision-making process. A structured framework ensures consistency and reduces decision fatigue. Start by documenting your criteria in a decision matrix. This should include:
- Cost: Total ownership cost (TOC) over 3 years, including licensing, maintenance, and hidden costs like data transfer fees.
- Time to Value: How long until the solution is operational (e.g., weeks vs. months).
- Scalability: Does the solution handle your current volume and future growth?
- Integration: Compatibility with existing tools (e.g., Snowflake, Airflow, or Databricks).
- Vendor Lock-in: Is the solution proprietary, or can you export data easily?
Next, assign weights to each criterion based on your team’s priorities. For example, if cost is critical, give it 40% weight; if flexibility is key, give integration 30%. This ensures you’re not biased toward low-cost solutions at the expense of long-term maintainability.
To validate your framework, test it against a recent decision. For instance, if you recently evaluated a data lakehouse solution, map its performance against your criteria. If the framework identifies gaps (e.g., poor scalability), refine it. This iterative approach builds confidence over time.
Automate as much as possible. Use tools like AWS Cost Explorer or Datadog to track costs, and set up alerts for performance thresholds. For custom-built solutions, log time-to-value metrics in a shared spreadsheet. This creates a single source of truth for future decisions.
Finally, train your team on the framework. Schedule a 30-minute review with your engineering and data teams to align on the criteria and weights. Use this as a recurring cadence—quarterly or after major projects—to keep the process sharp.
Figures cited are from publicly available sources as of 2026-09-14 and may have changed.