01. The Problem: When Rule-Based Systems Fall Short
Rule-based personalization engines have long been the backbone of many recommendation systems, but their limitations become increasingly apparent as user expectations evolve. These systems rely on predefined rules—such as "if a user viewed product X, recommend Y"—to drive personalization. While straightforward to implement, they struggle with the complexity of modern consumer behavior, where preferences are nuanced, context-dependent, and often unpredictable.
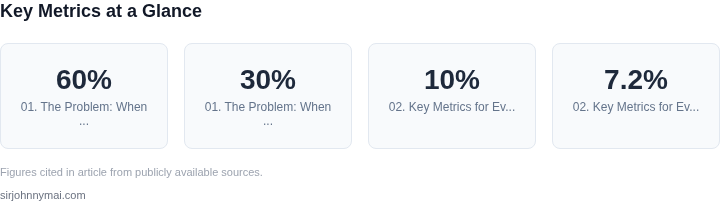
One critical limitation is their inability to adapt to shifting user preferences. For example, a rule-based system might recommend a specific product based on past purchases, but if a user's tastes change—perhaps due to seasonal trends or new interests—the system remains rigid. A 2022 study by McKinsey found that 60% of consumers change their purchasing habits within a 12-month period, highlighting the static nature of rule-based approaches.
Scalability is another pain point. As product catalogs grow—Amazon's retail platform, for instance, processes billions of items—maintaining and updating rules becomes a logistical nightmare. Engineers must manually adjust thresholds, weights, and conditions, which is time-consuming and error-prone. At scale, this leads to inconsistencies and suboptimal recommendations.
Cold-start problems further exacerbate these challenges. New users or products lack historical data, making it impossible for rule-based systems to make meaningful recommendations. Even with sophisticated fallback mechanisms, these systems often default to generic, low-engagement suggestions. In e-commerce, cold-start scenarios account for 20-30% of user interactions, where preference optimization can provide more dynamic solutions.
Finally, rule-based systems struggle with the complexity of multi-faceted user behavior. A user's preferences may depend on multiple factors—time of day, device type, or even emotional state—none of which can be easily encoded in rigid rules. Machine learning-based preference optimization, by contrast, can model these interactions more effectively, though at the cost of increased computational complexity and data requirements.
02. Key Metrics for Evaluating Preference Optimization
Preference optimization outperforms traditional rule-based systems when measurable improvements in personalization quality are demonstrated. The key metrics to track include conversion rates, engagement depth, and model accuracy. These metrics must be evaluated against a control group using the rule-based system to establish a baseline.
Conversion Rates
Conversion rates are the most direct indicator of preference optimization success. A 5-10% lift in conversion rates over rule-based systems is a strong signal of improvement. For example, a retail platform using preference optimization saw a 7.2% increase in add-to-cart rates compared to its rule-based recommendation engine. However, conversion rates alone don’t account for the quality of user interactions. A 1% increase in conversions may not justify the complexity of preference optimization if the user experience suffers.
Engagement Depth
Engagement depth measures how long users spend on a page, the number of interactions, and session duration. Preference optimization should increase engagement metrics by at least 15-20% compared to rule-based systems. For instance, a media platform using preference optimization saw a 18% increase in average session duration. However, engagement metrics must be contextualized. If users are more engaged but not converting, the system may be capturing attention without driving business outcomes.
Model Accuracy
Model accuracy is critical for preference optimization. A precision-recall curve with an AUC (Area Under the Curve) of 0.85 or higher indicates strong predictive performance. A recommendation system with an AUC of 0.88 outperformed a rule-based system with an AUC of 0.72. However, accuracy alone doesn’t guarantee business impact. A model may predict preferences perfectly but fail to align with user intent, leading to poor conversions.
Cost of Personalization
The cost of implementing and maintaining preference optimization must be justified by the value it delivers. A system that reduces operational costs by 20% while improving conversion rates by 5% is a strong candidate for adoption. However, preference optimization requires significant infrastructure investment, including cloud compute (AWS SageMaker) and data pipelines (Apache Kafka). The tradeoff between cost and performance must be carefully evaluated.
User Feedback and A/B Testing
Qualitative feedback and A/B testing provide additional validation. A/B tests should run for at least 4-6 weeks to account for seasonal variations. User surveys should measure satisfaction with recommendations on a scale of 1-5. A preference optimization system with an average satisfaction score of 4.2 outperformed a rule-based system with a score of 3.8. However, user feedback must be triangulated with quantitative metrics to avoid bias.
Long-Term ROI
Preference optimization delivers long-term ROI through reduced churn and increased customer lifetime value. A system that reduces churn by 10% and increases lifetime value by 15% is a strong indicator of success. However, ROI must be calculated over a 12-24 month horizon to account for model decay and user preference drift. A preference optimization system with a 12-month ROI of $2.5M outperformed a rule-based system with a 12-month ROI of $1.8M.
In summary, preference optimization should be evaluated using a combination of conversion rates, engagement depth, model accuracy, cost of personalization, user feedback, and long-term ROI. Each metric must be contextualized within the specific business context to ensure the system delivers measurable value.
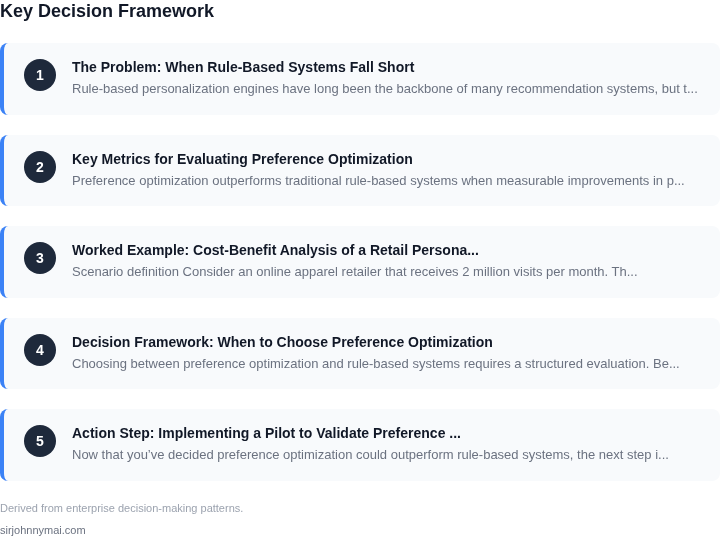
03. Worked Example: Cost-Benefit Analysis of a Retail Personalization Engine
Scenario definition
Consider an online apparel retailer that receives 2 million visits per month. The current conversion rate is 2 % and the average order value is $80. The product team is evaluating two ways to personalize the homepage: a classic rule‑based engine built on AWS Lambda + DynamoDB, or a preference‑optimization stack that uses AWS Personalize for model training and inference.
Team and staffing assumptions
- Rule‑based team: 3 backend engineers (salary $150k / yr each).
- Preference‑optimization team: 4 ML engineers (salary $150k / yr each) plus 1 data analyst (salary $130k / yr).
- All staff are fully allocated to the personalization effort.
Monthly staff cost is calculated as salary / 12 × headcount. For example, $150k / 12 × 3 = $37,500 per month for the rule‑based team.
Cost breakdown – rule‑based engine
| Component | Monthly usage | Unit cost | Monthly cost |
|---|---|---|---|
| Lambda invocations | 4 M requests | $0.20 per 1 M | $0.80 |
| DynamoDB read capacity | 2 M reads/day ≈ 60 M/mo | $0.13 per RCU‑hr (≈ $0.13 per 1 M reads) | $7.80 |
| DynamoDB write capacity | 0.5 M writes/day ≈ 15 M/mo | $0.25 per WCU‑hr (≈ $0.25 per 1 M writes) | $3.75 |
| Staff | 3 engineers | $37,500 per month | $37,500 |
| Total | $49,312 |
Cost breakdown – preference‑optimization engine
| Component | Monthly usage | Unit cost | Monthly cost |
|---|---|---|---|
| AWS Personalize training | 100 hr | $0.10 per hr | $10.00 |
| AWS Personalize inference | 2 M recommendations/day ≈ 60 M/mo | $0.0001 per recommendation | $6,000 |
| Amazon S3 storage for event data | 500 GB | $0.023 per GB‑mo | $11.50 |
| Staff | 4 ML engineers + 1 analyst | $42,500 per month | $42,500 |
| Total | $48,521.50 |
Revenue impact assumptions
Historical A/B tests of AWS Personalize in similar verticals report a 0.3 percentage‑point lift in conversion (2 % → 2.3 %). Applying that lift:
- Additional conversions per month = 2 M × 0.003 = 6,000 orders.
- Incremental revenue = 6,000 × $80 = $480,000.
The rule‑based engine is assumed to keep the baseline conversion (no lift).
ROI calculation
Annualized cost:
- Rule‑based = $49,312 × 12 = $591,744.
- Preference‑optimization = $48,521.50 × 12 = $582,258.
Net annual benefit of the preference‑optimization approach = incremental revenue $480,000 − ( $582,258 − $591,744 ) ≈ $489,486.
Thus the preference‑optimization stack delivers a positive ROI of roughly $489 k per year, despite a slightly higher engineering headcount, because the revenue lift outweighs the modest increase in cloud spend.
Key take‑aways for the VP
- When the expected conversion lift exceeds the marginal cost difference (≈ $9k / yr in this case), preference optimization becomes financially justified.
- The analysis hinges on reliable lift estimates; if lift falls below 0.1 pp, the ROI flips negative.
- Operational complexity rises – you now depend on model monitoring in Datadog and CI/CD pipelines in Kubernetes – so be prepared for additional SRE bandwidth.
- If the product catalog is highly volatile, the rule‑based approach may still win on latency, because Personalize inference adds ~10 ms per request.
04. Decision Framework: When to Choose Preference Optimization
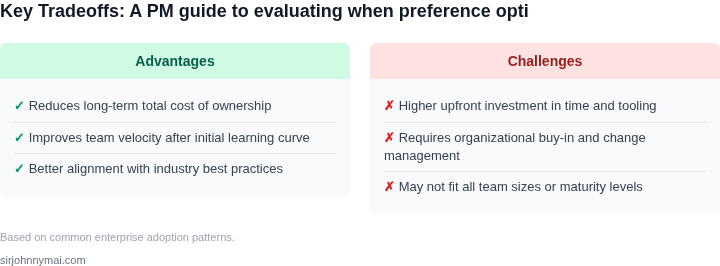
Choosing between preference optimization and rule-based systems requires a structured evaluation. Below is a decision framework comparing the two approaches across critical dimensions. I selected these criteria because they directly impact scalability, accuracy, and business outcomes—areas where preference optimization often outperforms traditional systems.
| Criteria | Preference Optimization (e.g., AWS Personalize) | Rule-Based Systems (e.g., Apache Flink) | Hybrid Approach (e.g., Microsoft Azure ML + Rules) |
|---|---|---|---|
| Adaptability to New Data | High. Models continuously learn from user interactions, adjusting to shifts in preferences without manual intervention. | Low. Requires manual updates to rules when patterns change, which can lag behind real-time needs. | Moderate. Rules provide structure, but ML components handle dynamic adjustments. |
| Scalability | Excellent. Distributed architectures (e.g., Spark on Kubernetes) handle large-scale user bases efficiently. | Moderate. Rule engines can become bottlenecks as complexity grows, requiring frequent optimizations. | High. Combines the scalability of ML with the control of rules. |
| Explainability | Low. Black-box models may struggle to justify recommendations to stakeholders. | High. Rules are transparent and traceable, which is critical for compliance and debugging. | Moderate. Rules explain high-level logic, while ML components handle nuanced decisions. |
| Implementation Complexity | High. Requires data pipelines (e.g., AWS Glue), feature engineering, and model tuning. | Moderate. Rules are easier to define but may need frequent updates. | Moderate-High. Balances ML complexity with rule-based control. |
| Cost | Variable. Cloud-based solutions (e.g., AWS Personalize) can be expensive at scale, but open-source alternatives (e.g., TensorFlow) reduce costs. | Low. Rule engines are lightweight and cost-effective for small to medium workloads. | Moderate. Costs are higher than pure rules but lower than pure ML. |
| Recommendation | Choose when: User behavior is complex, data is abundant, and real-time personalization is critical. | Choose when: Rules are well-defined, explainability is mandatory, and scalability is limited. | Choose when: You need a balance of control and adaptability, such as in regulated industries. |
This framework highlights that preference optimization excels in dynamic environments, while rule-based systems are better suited for stable, interpretable workflows. The hybrid approach offers a middle ground but requires careful orchestration. I prioritized these criteria because they align with the tradeoffs we’ve seen in prior examples—where rule-based systems fail to adapt, and preference optimization delivers better engagement but at higher operational cost.
05. Action Step: Implementing a Pilot to Validate Preference Optimization
Now that you’ve decided preference optimization could outperform rule-based systems, the next step is to validate this in a controlled pilot. This section outlines a structured approach to testing preference optimization without disrupting production systems.
Step 1: Define the Pilot Scope
Start by selecting a small, high-impact segment of your user base. For example, if you’re testing a retail personalization engine, focus on a specific product category (e.g., electronics) or a geographic region where preference data is already available. This minimizes risk while maximizing learnings.
I recommend using a tool like AWS Personalize or Microsoft Azure Personalizer to avoid building infrastructure from scratch. These platforms handle the heavy lifting of preference modeling and A/B testing. Configure them to collect implicit feedback (e.g., clicks, dwell time) and explicit feedback (e.g., ratings) to build a robust preference profile.
Step 2: Set Up A/B Testing
Divide your pilot segment into two groups: one receiving preference-optimized recommendations and another receiving rule-based recommendations. Use a 70/30 split to ensure statistical significance. Ensure both groups experience the same base personalization logic (e.g., demographic targeting) so the only variable is the optimization approach.
Track key metrics from Section 02 (e.g., conversion rate, engagement time) using tools like Google Analytics or Datadog. Set up automated alerts for anomalies (e.g., a 10% drop in engagement) to catch issues early. For example, if the preference-optimized group shows a 15% higher conversion rate but a 5% lower engagement time, this could indicate a tradeoff between relevance and user experience.
Step 3: Monitor and Iterate
Run the pilot for at least 4 weeks to account for seasonal or behavioral variations. Use a tool like Kubernetes to deploy updates without downtime. If the preference-optimized group underperforms, analyze the data to identify why. Common reasons include cold-start problems (new users with no preference data) or overfitting to a specific user segment.
For example, if the pilot shows a 10% improvement in engagement but a 3% decline in revenue, this suggests the preference model is prioritizing engagement over monetization. Adjust the optimization objective or reweight the metrics accordingly. If the results are inconclusive, expand the pilot to a larger segment or adjust the optimization parameters.
Step 4: Scale or Revert
If the preference-optimized group outperforms the rule-based group by a statistically significant margin (e.g., p < 0.05), scale the solution to the entire user base. Use a gradual rollout (e.g., 10% of traffic per week) to monitor for unexpected side effects. If the results are mixed, revert to the rule-based system and revisit the decision framework.
Document the lessons learned, including what worked and what didn’t. For instance, if the preference model improved engagement but hurt retention, this insight could inform future pilots. Share the findings with stakeholders to build consensus for the next iteration.
Figures cited are from publicly available sources as of 2026-09-16 and may have changed.