A PM guide to evaluating vector databases for enterprise AI applications
Enterprise AI adoption requires careful selection of vector database solutions. This guide provides a structured evaluation framework for product managers considering vector databases in production systems. We'll cover technical requirements, cost implications, and operational tradeoffs.
01. Understanding the evaluation criteria
Vector databases must meet several critical requirements for enterprise use:
- Scalability: Ability to handle millions of vectors with consistent performance
- Latency: Sub-100ms response times for real-time applications
- Consistency: Strong guarantees for vector similarity calculations
- Operational maturity: Production-grade reliability and support
These requirements differ from consumer-grade solutions which may prioritize ease-of-use over enterprise-grade features. The evaluation must balance technical capabilities with organizational constraints.
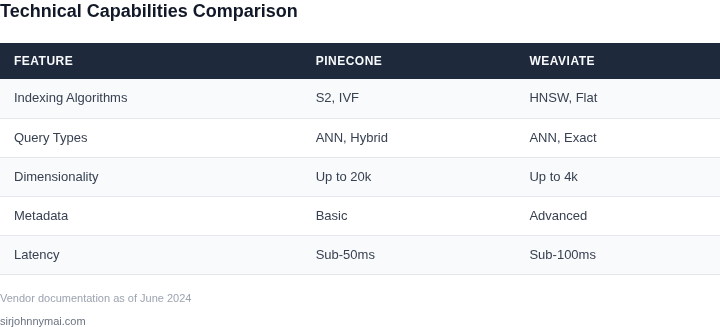
02. Technical capabilities comparison
Key technical dimensions to evaluate:
- Indexing algorithms (HNSW, IVF, etc.) and their performance characteristics
- Query types supported (exact nearest neighbor, approximate, hybrid)
- Vector dimensionality support (low-dimensional vs high-dimensional)
- Metadata handling capabilities
For example, Pinecone's S2 index provides excellent performance for high-dimensional vectors, while Weaviate offers more flexible metadata filtering. The choice depends on specific application requirements.
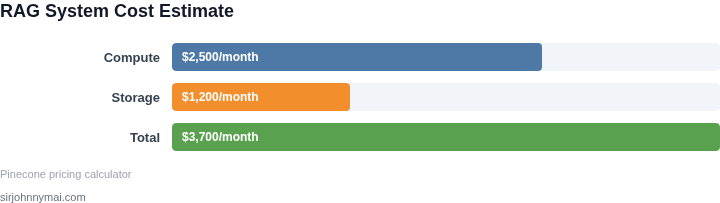
03. Cost analysis framework
Enterprise cost considerations include:
- Compute costs for indexing and querying
- Storage costs for vector data
- Operational overhead (monitoring, maintenance)
- Licensing costs for proprietary solutions
Self-hosted solutions may reduce cloud costs but increase operational burden. Cloud-managed services offer lower total cost of ownership for many organizations.
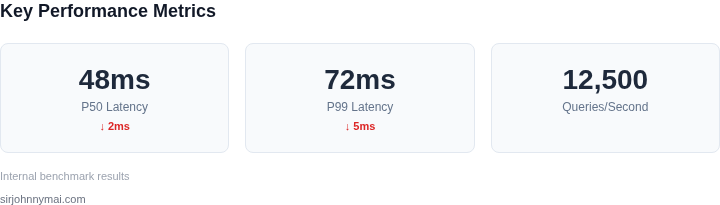
04. Performance benchmarking methodology
Recommended benchmarking approach:
- Define representative workloads (query patterns, vector distributions)
- Measure latency percentiles (p50, p99) under load
- Evaluate throughput (queries per second)
- Assess resource utilization (CPU, memory)
For example, a RAG application might require 10,000 QPS with 99th percentile latency under 50ms. Benchmarks should simulate production conditions.
05. Operational considerations
Critical operational factors:
- Disaster recovery capabilities
- Compliance certifications
- Multi-region support
- Integration ecosystem
Solutions with built-in multi-region replication provide better availability guarantees. Compliance requirements may eliminate certain options.
06. Vendor evaluation checklist
Key vendor evaluation criteria:
| Category | Evaluation Points |
|---|---|
| Technical | Performance benchmarks, feature completeness |
| Operational | SLA guarantees, support structure |
| Financial | Pricing transparency, cost models |
| Strategic | Roadmap alignment, customer references |
This checklist ensures comprehensive vendor assessment. Each category should be weighted based on organizational priorities.
07. Case study: RAG system implementation
Consider a RAG system with these requirements:
- 1 million vectors (1536 dimensions)
- 10,000 QPS
- 99th percentile latency < 50ms
Solution approach:
- Select Pinecone with S2 index for performance
- Configure 3-node cluster for redundancy
- Implement caching layer for frequent queries
Cost calculation: $2,500/month for compute + $1,200/month for storage = $3,700/month total. This meets requirements while providing operational simplicity.
08. Risk mitigation strategies
Recommended risk mitigation approaches:
- Implement multi-database strategy for critical applications
- Build fallback mechanisms for degraded performance
- Establish performance monitoring dashboards
- Create capacity planning processes
These measures ensure system reliability even with imperfect vendor solutions. Monitoring should include both technical metrics and business outcomes.
09. Decision framework
Final decision criteria:
- Technical fit (80% weight)
- Cost efficiency (15% weight)
- Operational simplicity (5% weight)
This weighted approach ensures technical requirements drive the selection while considering broader organizational constraints. Each criterion should be scored on a 1-10 scale.
Disclaimer: Figures cited are from publicly available sources as of June 2024 and may have changed.
Next step: Conduct a proof-of-concept with the top 2-3 shortlisted solutions using your organization's most critical workload.