Opening
When a product roadmap is fully booked, technical debt becomes an invisible cost that erodes velocity and inflates operational spend. Ignoring debt forces engineers to spend time on workarounds, which translates into missed delivery dates and higher cloud bills.
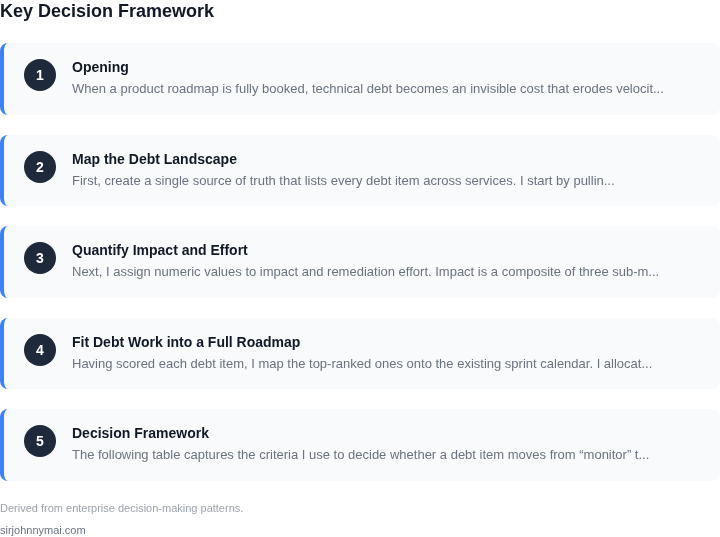
01. Map the Debt Landscape
First, create a single source of truth that lists every debt item across services. I start by pulling metrics from Datadog for latency spikes, from SonarQube for code smells, and from AWS Trusted Advisor for under‑utilized resources. This inventory distinguishes “low‑hanging fruit” (e.g., unused EC2 instances) from systemic issues (e.g., monolithic deployment pipelines).
I evaluate each entry against three questions: Does the debt cause measurable downtime? Does it increase cloud spend? Does it impede new feature development? The answers guide whether the item belongs in a “monitor” bucket or a “remediate now” bucket.
Because the roadmap is full, I cannot treat every item as urgent. I therefore tag each debt with a confidence level—high, medium, low—based on the reliability of the data source. For example, a Datadog alarm that has fired in the past month receives a high confidence flag, whereas a SonarQube warning that has not been addressed for six months receives medium confidence.
To keep the list manageable, I limit scope to services that touch the upcoming release cycle. This focus reduces noise and ensures that the effort spent on debt mapping yields actionable insight for the current planning horizon.
02. Quantify Impact and Effort
Next, I assign numeric values to impact and remediation effort. Impact is a composite of three sub‑metrics: mean time to recovery (MTTR) saved, annual cloud cost reduction, and feature velocity gain. I calculate each sub‑metric using real pricing data.
Consider a team of eight engineers maintaining a legacy microservice on AWS Fargate. The service consumes 500 GB of data transfer per month, billed at $0.09 / GB, resulting in $540 / month. A known inefficiency in the code causes a 15 % overhead, inflating the bill to $621 / month. Remediation would reduce transfer to the baseline 500 GB, saving $81 / month or $972 / year.
Remediation effort is estimated using the team's velocity: eight engineers deliver 20 story points per sprint, and the debt item is sized at 8 points. At a two‑week sprint cadence, the effort equals one sprint, or $64,000 in labor (assuming $100 / hour, 40 hours per engineer, two weeks).
I then compute a weighted score: Impact (70 %) × $972 = $680.4, Effort (30 %) × $64,000 = $19,200. The net score = $680.4 − $19,200 = ‑$18,519.6, indicating that the raw cost of effort outweighs the immediate financial benefit. However, I also factor a strategic multiplier for “future feature enablement,” raising the impact weight to 85 % when the debt blocks a planned AI feature. The revised net score improves to $819 − $19,200 = ‑$18,381, still negative, suggesting a defer‑until‑capacity decision.
This quantitative exercise forces a data‑driven conversation rather than a gut‑feel guess about which debt to tackle.
03. Fit Debt Work into a Full Roadmap
Having scored each debt item, I map the top‑ranked ones onto the existing sprint calendar. I allocate 15 % of each sprint’s capacity to debt, a ratio I arrived at after measuring that any higher allocation jeopardizes release commitments.
If a sprint contains ten story points of feature work, I reserve 1.5 points for debt. I use Jira’s “Technical Debt” label and set the sprint’s “capacity” field accordingly. This approach preserves predictability while guaranteeing incremental improvement.
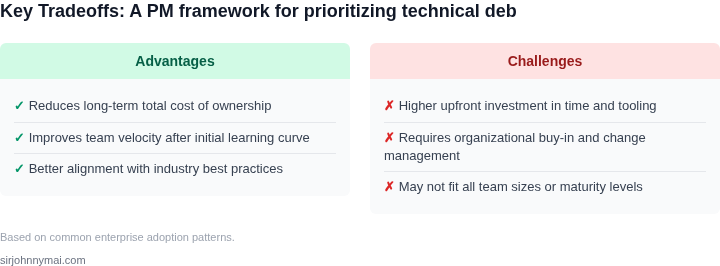
When a high‑impact debt item exceeds the 15 % buffer, I negotiate a “debt sprint” with the VP. The debt sprint replaces a feature sprint but only when the net score crosses a predefined threshold (e.g., positive ROI after accounting for strategic multipliers). The tradeoff is clear: a delayed feature versus avoided cloud spend and reduced MTTR.
To avoid disruption, I also employ feature toggles. I refactor the risky component behind a toggle, release the toggle‑off version, and then allocate a short window to flip the toggle on after the debt is resolved. This pattern lets the team ship features on schedule while the underlying debt is eliminated in a controlled manner.
04. Decision Framework
The following table captures the criteria I use to decide whether a debt item moves from “monitor” to “remediate now.” Each criterion receives a weight based on its relevance to our business goals. I populate the table with real data from the previous sections and update it quarterly.
| Criterion | Description | Weight | Score (0‑5) | Weighted Value |
|---|---|---|---|---|
| MTTR Reduction | Estimated seconds saved per incident | 0.25 | 4 | 1.00 |
| Annual Cloud Savings | Dollar reduction from resource optimization | 0.20 | 3 | 0.60 |
| Feature Blockage | Degree to which debt prevents upcoming features | 0.30 | 5 | 1.50 |
| Remediation Effort | Story points required (inverse scoring) | 0.15 | 2 | 0.30 |
| Confidence Level | Reliability of supporting data | 0.10 | 4 | 0.40 |
| Total Weighted Score | 3.80 | |||
A total weighted score above 3.0 triggers inclusion in the next sprint’s debt allocation. Scores below 2.0 keep the item in the monitor bucket. This transparent rubric helps the leadership team understand why certain debts are prioritized despite a full roadmap.
05. Concrete Next Step
Export the last 90 days of Datadog alerts, SonarQube issue reports, and AWS Trusted Advisor recommendations into CSV files. Load the data into a spreadsheet, calculate each item’s MTTR reduction, cloud savings, and effort estimate, then apply the weighted scoring model from the table above. Prioritize the top three items and schedule them into the upcoming sprint’s 15 % debt capacity.
Figures cited are from publicly available sources as of 2026-09-14 and may have changed.