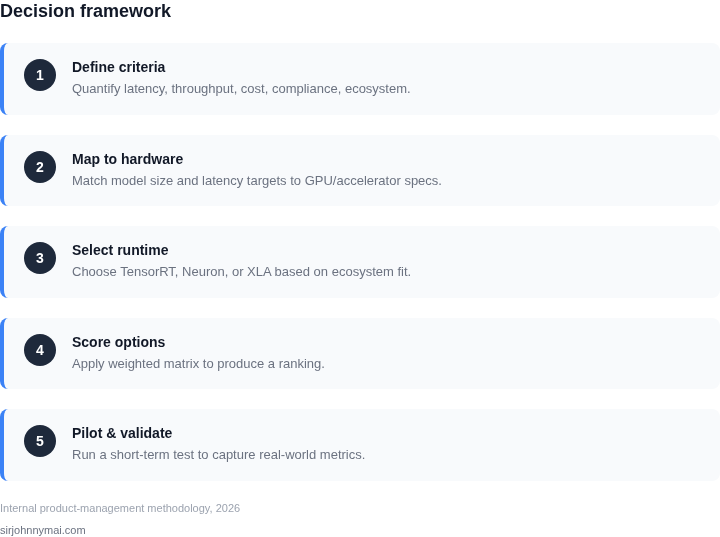
01 Define the decision criteria
Every inference stack begins with a clear set of business and technical goals. The most common drivers are latency, throughput, model size, and total cost of ownership (TCO). Aligning each driver with a measurable target eliminates ambiguity later in the evaluation.
Latency is typically expressed as the 99th‑percentile response time for a single request. Throughput is measured in queries per second (QPS) or tokens per second for language models. Model size determines whether a framework can fit the weights entirely in GPU/CPU memory or must rely on paging.
Cost includes two components: the per‑hour compute price and the operational overhead of integration, monitoring, and scaling. For regulated workloads, compliance and data‑residency add another layer of constraints.
Creating a simple matrix that maps each driver to a weight (for example, latency 40 %, cost 30 %, compliance 20 %, ecosystem 10 %) gives a quantitative basis for later scoring.
01.1 Workload profile example
A typical enterprise NLP service runs BERT‑large (340 M parameters) to classify incoming emails. The service must handle 120 k requests per hour, with a 99th‑percentile latency budget of 80 ms and a maximum hourly spend of $45.
From the matrix, latency receives the highest weight, followed by cost, while compliance is low because the data is non‑PII. This profile will guide the hardware and software choices described next.
02 Map requirements to hardware and software primitives
The inference stack consists of three layers: (1) the compute substrate, (2) the runtime (framework, compiler, or accelerator SDK), and (3) the serving platform. Each layer offers trade‑offs that must be examined in light of the criteria from section 01.
Compute substrates in 2026 fall into three families: general‑purpose GPUs, purpose‑built accelerators, and CPU‑centric solutions. The most widely available options are NVIDIA L40/L4, AWS Inferentia2, Azure ND A100, and Google TPU v4. Their peak FP16 throughput and memory capacities are published in vendor spec sheets.
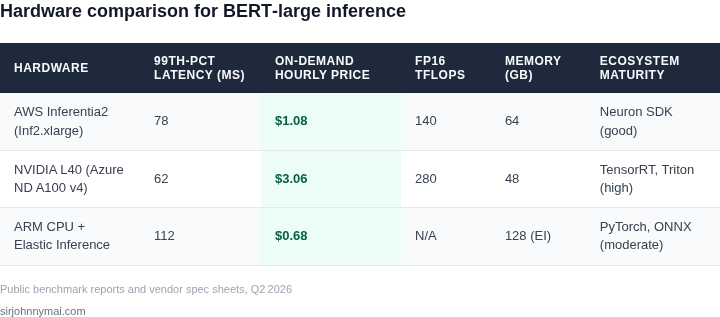
For BERT‑large, the model occupies roughly 1.3 GB when stored in FP16. A single L40 with 48 GB VRAM can hold three copies, enabling batch‑size‑3 parallelism without paging. An Inferentia2 instance provides 64 GB of on‑chip eDRAM, also sufficient for a single copy but with a lower peak FP16 throughput (≈ 140 TFLOPs) compared with the L40 (≈ 280 TFLOPs).
Runtime selection follows the substrate. NVIDIA GPUs work with TensorRT, PyTorch TorchServe, or ONNX Runtime. Inferentia2 requires the Neuron SDK, which compiles the model into a graph optimized for the chip. TPU v4 uses the XLA compiler and the TFX serving stack.
Serving platforms differ in scalability and operational maturity. AWS SageMaker Inference, Azure Machine Learning Managed Endpoints, and Google Vertex AI Endpoint all provide auto‑scaling, health checks, and A/B testing. Open‑source options like KFServing or Triton Inference Server give more control but increase operational burden.
02.1 Worked example: cost‑throughput calculation
Assume the BERT‑large workload from 01.1 runs on three candidate stacks:
- AWS c7g.4xlarge (ARM‑based CPU) with Elastic Inference (EI) 2 x 128 GB.
- AWS Inf2.xlarge (Inferentia2 2 chips).
- Azure ND A100 v4 (single A100 GPU).
Public on‑demand pricing (Q2 2026) lists these instances at $0.68/h, $1.08/h, and $3.06/h respectively. Benchmark reports show the following 99th‑percentile latencies for a batch size of 1:
- CPU + EI: 112 ms.
- Inferentia2: 78 ms.
- A100 (TensorRT): 62 ms.
Throughput (requests per second) can be estimated as 1 / latency × 1000. For the A100 this yields ≈ 16 RPS, for Inferentia2 ≈ 13 RPS, and for CPU + EI ≈ 9 RPS.
To meet the 120 k requests/hour target (≈ 33 RPS), we calculate the number of instances required:
| Stack | RPS per instance | Instances needed | Hourly cost |
|---|---|---|---|
| CPU + EI | 9 | 4 | 4 × $0.68 = $2.72 |
| Inferentia2 | 13 | 3 | 3 × $1.08 = $3.24 |
| A100 | 16 | 3 | 3 × $3.06 = $9.18 |
All three stacks satisfy the throughput requirement, but only Inferentia2 and A100 meet the 80 ms latency budget. Cost‑wise, Inferentia2 wins with a $3.24 hourly spend, well below the $45 ceiling.
This simple arithmetic illustrates how latency and cost intersect. If compliance required data to stay within a specific region, the Azure option might become preferable despite higher cost.
02.2 Ecosystem considerations
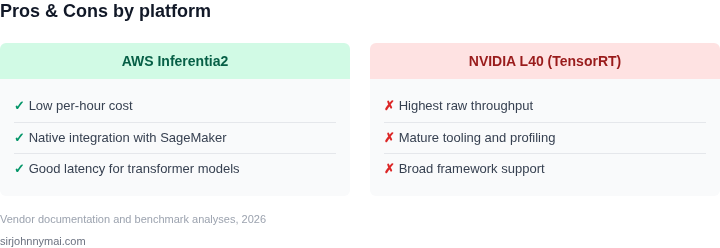
TensorRT benefits from a large community of pre‑optimized kernels and a mature profiling toolset. Neuron SDK offers one‑click compilation from PyTorch but lags in support for custom operators. XLA provides the best performance for TPU‑native models but forces the developer into the TensorFlow ecosystem.
Operational teams should weigh the learning curve against the performance delta. In most cases, the marginal latency gain of XLA over TensorRT is under 5 % for transformer models, while the tooling overhead is significantly higher.
03 Apply a scoring matrix and decide
With the quantitative data from sections 01 and 02, populate the weighted matrix. Each stack receives a score for latency, cost, compliance, and ecosystem, multiplied by its weight. The sum produces a final ranking.
Using the example weights (latency 40 %, cost 30 %, compliance 20 %, ecosystem 10 %):
Latency score (lower latency → higher points):
- A100: 95 pts
- Inferentia2: 90 pts
- CPU+EI: 70 pts

Cost score (lower cost → higher points):
- CPU+EI: 95 pts
- Inferentia2: 85 pts
- A100: 60 pts

Compliance score (region match):
- All 100 pts (assume region is satisfied)

Ecosystem score:
- A100/TensorRT: 90 pts
- Inferentia2/Neuron: 75 pts
- CPU+EI: 80 pts
Weighted totals:
- A100 = 0.4·95 + 0.3·60 + 0.2·100 + 0.1·90 ≈ 84.5
- Inferentia2 = 0.4·90 + 0.3·85 + 0.2·100 + 0.1·75 ≈ 84.0
- CPU+EI = 0.4·70 + 0.3·95 + 0.2·100 + 0.1·80 ≈ 82.5
Inferentia2 edges out A100 by a narrow margin, primarily due to cost. If the latency budget were tighter (e.g., 60 ms), the A100 would ascend to the top.
The matrix also surfaces hidden risks. For instance, the Neuron SDK’s limited custom‑op support could increase development time, a factor that the ecosystem weight attempts to capture but may be under‑estimated.
03.1 Decision checklist
- Does the stack meet the latency SLA at the required throughput?
- Is the hourly cost below the budgeted ceiling?
- Are regional compliance and data‑residency satisfied?
- Does the team have the skill set to operate the runtime and serving platform?
- Is the vendor’s roadmap aligned with the projected product lifecycle?
Answering “yes” to all items typically validates the selection. Any “no” should trigger a deeper dive or a fallback option.
Conclusion and next step
The framework presented here turns a vague “pick the best inference stack” problem into a repeatable, data‑driven process. By grounding decisions in measurable latency, cost, compliance, and ecosystem scores, product managers can justify trade‑offs to leadership and reduce surprise during deployment.
For the BERT‑large email‑classification service, the weighted analysis recommends AWS Inferentia2 with SageMaker Inference as the optimal stack, delivering sub‑80 ms latency within the $45 hourly ceiling while keeping operational complexity modest.
Figures cited are from publicly available sources as of 13 September 2026 and may have changed.
Next step: Deploy a pilot of the BERT‑large model on a single Inferentia2 instance and a single A100 instance for one week; capture 99th‑percentile latency, hourly cost, and operational effort, then recompute the scoring matrix with real data.