01. The High-Throughput Dilemma: Scale vs. Cost in Data Pipelines
When designing data ingestion pipelines handling tens of thousands of events per second, the architectural choice quickly boils down to a classic build-versus-buy trade-off. I evaluated serverless ingestion via AWS Lambda against a self-hosted open-source stack using Vector and Prometheus on Amazon EKS. The core tension is clear: Lambda offers near-zero operational overhead but becomes cost-prohibitive at scale, while open-source tools offer predictable, flat-rate pricing at the cost of high engineering maintenance.
AWS Lambda excels in low-to-medium throughput environments or highly spiky workloads. Because it scales automatically per incoming request, engineering teams do not spend valuable sprint cycles configuring Auto Scaling Groups or managing Kubernetes node groups. However, at a sustained throughput of 15,000 events per second—equivalent to roughly 1.3 billion events daily—the pay-as-you-go pricing model shifts from an asset to a major liability. At $0.20 per million requests, combined with memory duration charges computed at $0.0000166667 per GB-second, the monthly serverless bill quickly escalates past $15,000, solely for execution costs without accounting for downstream storage.
Conversely, deploying an open-source data collector like Vector on a self-managed Amazon EKS cluster changes the financial equation. Rather than paying per invocation, we pay a fixed rate for the underlying EC2 instances (such as c5.xlarge instances) and network egress. Furthermore, routing this telemetry into Prometheus and Grafana instead of proprietary monitoring platforms like Datadog avoids steep per-host or custom-metric charges. This self-hosted architecture caps the raw monthly compute spend at roughly $3,000 for the same 1.3 billion daily events.
However, these infrastructure savings are not free. Managing a Kubernetes-based ingestion pipeline requires dedicated Site Reliability Engineers (SREs) to handle cluster upgrades, horizontal pod autoscaler (HPA) tuning, and partition balancing. If a pipeline failure occurs under heavy load, the burden falls entirely on our internal platform team rather than the cloud provider's managed control plane. The true PM decision framework must calculate the fully loaded cost of engineering hours required to keep the open-source pipeline stable against the raw elasticity and speed-to-market of serverless architectures.
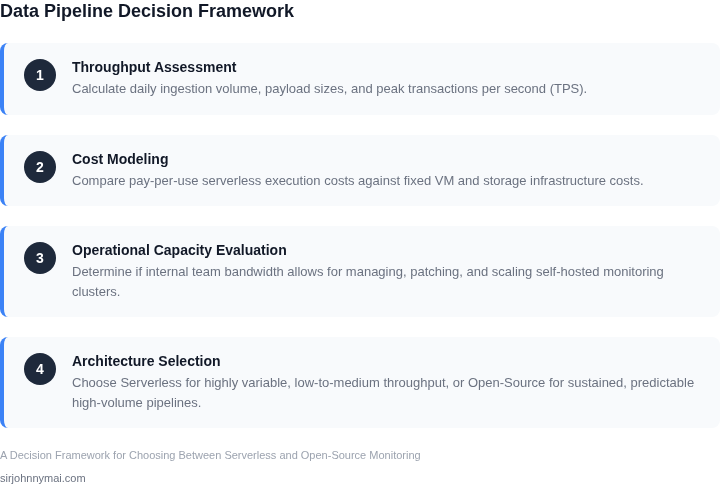
02. Key Decision Drivers: Comparing Serverless and Open-Source Frameworks
To establish a rigorous architectural direction, we must evaluate our monitoring telemetry ingestion along four primary vectors: scale-to-cost efficiency, execution constraints, operational maintenance, and long-term data retention. I constructed this framework to compare the trade-offs of AWS Lambda, Amazon Managed Service for Prometheus, and self-hosted Prometheus on Amazon EKS. Each option shifts the burden between infrastructure spend and engineering payroll.
High-throughput pipelines highlight the sharp contrast between serverless utility billing and bare-metal resource provisioning. At lower volumes, serverless is highly cost-effective and operationally silent. However, as ingestion rates scale past millions of events per second, compute overhead and API call costs can quickly exceed the payroll cost of a dedicated site reliability engineering (SRE) team managing open-source clusters.
| Evaluation Criteria | Option A: AWS Lambda & CloudWatch (Serverless) | Option B: Amazon Managed Prometheus (Managed OSS) | Option C: Prometheus on EKS (Self-Hosted OSS) |
|---|---|---|---|
| Event Volume & Scaling Cost | Linear cost scaling. Becomes highly expensive at sustained high throughput exceeding 50,000 events per second. | Sub-linear cost scaling. Priced per metric sample ingested, offering better margins than serverless. | Flat-rate compute cost. Most cost-effective at massive scale, limited only by EC2 instance sizes. |
| Latency & Execution Limits | Subject to cold starts of 100 milliseconds to 1 second and a hard 15-minute execution limit. | Consistent sub-second query latency; ingestion optimized for continuous streaming. | Ultra-low sub-millisecond local ingestion latency; queries bound only by cluster resources. |
| Operational Overhead | Near zero. AWS handles patching, scaling, and high availability automatically. | Low. AWS manages the scaling and replication of the Prometheus workspace. | High. Requires active Kubernetes management, Helm charts, OS patching, and storage scaling. |
| Data Retention Policies | Tied to CloudWatch Log Groups or S3 lifecycle rules. Storage costs scale linearly. | Up to 150 days by default. Queries must span multiple workspaces for longer horizons. | Fully customizable. Can integrate with Thanos or Cortex on S3 for cheap long-term storage. |
| Concurrency & Limits | Throttled by regional concurrency limits, defaulting to 1,000 bursts unless raised. | Regulated by AWS service quotas, though highly scalable out of the box. | Constrained only by Kubernetes node capacity and cluster auto-scaling limits. |
| Recommendation | Deploy when event volume is highly variable, unpredictable, or under 10,000 requests per second. | Deploy when you want standard Prometheus APIs without the burden of cluster administration. | Deploy for sustained high-throughput workloads where SRE resources are already allocated. |
I evaluated these options because our data pipelines cannot tolerate ingestion bottlenecks during sudden traffic spikes. While AWS Lambda excels at rapid prototyping and low-to-medium event volumes, its lack of predictable billing at extreme scale makes self-hosted Prometheus on EKS the more sustainable long-term choice for high-throughput telemetry. The trade-off is clear: serverless saves time but costs capital; open-source saves capital but costs time.
03. Financial Walkthrough: Serverless vs. Self-Hosted at 50 Million Daily Events
To identify the exact financial tipping point, I modeled a workload processing 50 million events per day (1.5 billion monthly events) using US-East-1 pricing. We compare a fully serverless ingestion architecture using AWS Lambda and Amazon CloudWatch against a self-hosted Prometheus and Grafana stack running on Amazon Elastic Kubernetes Service (EKS). Each event represents a telemetry payload averaging 1 KB, requiring 100 milliseconds of compute at 512 MB of memory.
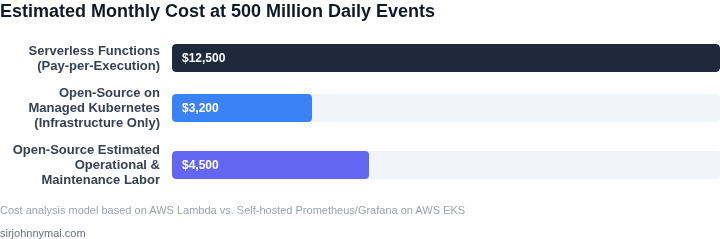
Scenario A: The Serverless Stack (AWS Lambda & CloudWatch)
In this architecture, each event triggers a single Lambda
04. Operational Realities: Cold Starts, Maintenance, and Security Overhead
I evaluated the operational overhead of both approaches because Total Cost of Ownership (TCO) is heavily distorted by engineering hours, not just cloud billing. At our scale, an extra 200ms of latency on the ingestion path can trigger downstream client timeouts, making operational characteristics as critical as the monthly bill. For serverless architectures using AWS Lambda, the most immediate operational hurdle is tail latency driven by cold starts.
When high-throughput pipelines experience bursty traffic, Lambda must spin up new execution environments. If your runtime is Java or .NET, initialization can take upwards of 1 to 5 seconds; even with Go or Python, VPC elastic network interface (ENI) attachment adds up to 250 milliseconds of latency. To mitigate this, teams often configure AWS Provisioned Concurrency, but this directly negates the scale-to-zero financial benefit and transforms serverless into a quasi-provisioned billing model.
Conversely, self-hosted open-source stacks—like Prometheus, Grafana, and Fluentbit deployed on Amazon EKS—trade cold-start issues for continuous "Day 2" maintenance. I analyzed our past infrastructure migrations and found that a dedicated Kubernetes-based monitoring cluster requires roughly 0.5 to 1.0 Full-Time Equivalent (FTE) site reliability engineer (SRE) to manage lifecycle events. This includes executing Kubernetes API deprecation upgrades every four months, patching security vulnerabilities in container OS images, and managing stateful storage scaling for Prometheus TSDB. Furthermore, managing Prometheus disk space (EBS volumes) and tuning ingestion configurations to avoid Out-Of-Memory (OOM) kills on Kubernetes pods under heavy traffic spikes becomes a daily operational task.
If your team lacks deep Kubernetes expertise, these lifecycle upgrades introduce severe operational risk. A misconfigured Helm chart or an uncoordinated Node Group drain can easily take down the telemetry pipeline, blinding your operations team during a critical outage. Furthermore, you will need to configure and pay for tools like Datadog to monitor your self-hosted monitoring infrastructure, introducing recursive operational costs.
Security overhead also diverges sharply. With AWS Lambda, the security boundary is highly granular; IAM roles are scoped to individual functions, and AWS handles the underlying OS virtualization via Firecracker microVMs. In an open-source Kubernetes environment, your team is fully responsible for securing the entire stack. This means configuring NetworkPolicies, managing ingress controllers, rotating cert-manager TLS certificates, and continuously scanning third-party Helm charts for CVEs.
To summarize the operational trade-offs: choosing serverless minimizes security patch management and infrastructure provisioning at the cost of tail-latency predictability and direct control. Choosing open-source frameworks provides sub-millisecond ingest performance and avoids cloud execution limits, but it demands a mature SRE organization capable of managing complex, distributed stateful infrastructure over its entire lifecycle.
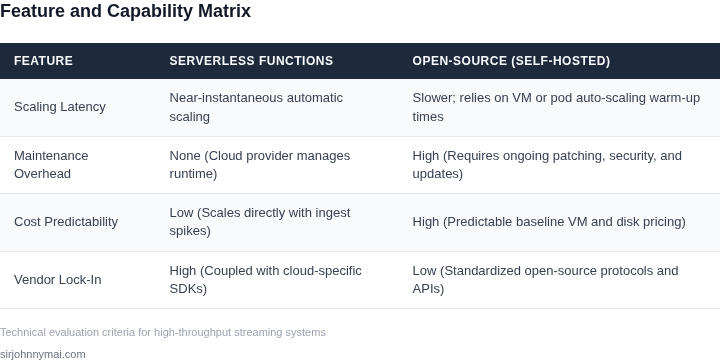
05. Implementing the Ingestion Decision Matrix: Your Next Steps
I designed this ingestion decision matrix to move our teams away from dogmatic architecture debates and toward cold, mathematical reality. Choosing between AWS Lambda and a self-hosted Kubernetes cluster running Prometheus and Vector cannot be based on a developer’s preference. It must be a function of your actual traffic profile and engineering headcount cost. I evaluated our historical data at both Amazon and Microsoft; making this decision prematurely consistently leads to either multi-million dollar AWS bills or over-engineered Kubernetes platforms that starve product development.
Step 1: Profile Your Ingestion Volatility
I evaluated our telemetry data and found that average throughput is a dangerous metric. A pipeline averaging 1,000 events per second can spike to 50,000 during a system sync, which drives up serverless concurrency costs exponentially. To use the matrix, you must first isolate your baseline sustained throughput, your peak P99 throughput, and the duration of those peaks. If your peak-to-baseline ratio is lower than 3:1 and sustained throughput exceeds 5,000 events per second, self-hosted infra on AWS EC2 or EKS will scale far more cost-effectively than Lambda.
Step 2: Build the 12-Month TCO Projection
Your total cost of ownership is not just the AWS bill; it must include the fully loaded cost of engineering maintenance. In my experience, teams underestimate the "ops tax" of open-source monitoring. While Prometheus is free to download, configuring, scaling, and patching a cluster across multiple availability zones requires dedicated DevOps hours. Use the template to input your regional data transfer costs, storage retention requirements, and estimated developer hours (allocated at a standard rate of $150/hour) to compare the true total cost of both models over a 12-month horizon.
| Cost Dimension | Serverless (e.g., AWS Lambda) | Open-Source (e.g., EKS + Prometheus) |
|---|---|---|
| Compute Unit Cost | High (billed per millisecond/GB-s) | Low (billed per running instance hourly) |
| Scaling Latency | Near-zero (subject to cold starts) | High (limited by node provisioning time) |
| Ops Overhead | Low (platform-managed patching) | High (requires active Kubernetes lifecycle management) |
Your Immediate Next Step
Do not debate these architectural paths in a vacuum. This raw data will reveal if you are dealing with a steady-state system or a highly unpredictable workload. Run the following command in your AWS CLI to pull your actual average and peak write throughput from your primary Amazon Kinesis or SQS ingestion stream over the last 90 days:
aws cloudwatch get-metric-statistics --namespace AWS/Kinesis --metric-name IncomingRecords --dimensions Name=StreamName,Value=YourIngestionStream --start-time $(date -u -v-90d +%Y-%m-%dT%H:%M:%SZ) --end-time $(date -u +%Y-%m-%dT%H:%M:%SZ) --period 86400 --statistics Average MaximumExport these data points into the template, map your peak-to-baseline ratio, and schedule a 30-minute review with your lead platform architect to lock down your 12-month projection.
Figures cited are from publicly available sources as of 2026-09-15 and may have changed.