01. The Problem: Balancing Control and Convenience
When a team decides to run a service such as a service mesh, a metrics stack, or a database on Kubernetes, the first fork in the road is whether to consume a managed add‑on provided by the cloud vendor or to install and operate a self‑managed operator.
Managed add‑ons such as Amazon EKS add‑on for AWS Load Balancer Controller or Azure AKS add‑on for Azure Monitor reduce the time‑to‑value because the provider handles version upgrades, security patches, and integration with the underlying control plane.
The convenience comes at a cost: you surrender fine‑grained configuration knobs, you become dependent on the vendor’s release cadence, and you may pay for additional compute or storage that the provider provisions automatically.
Self‑managed operators—e.g., the Prometheus Operator from the CNCF community or the CrunchyData PostgreSQL Operator—give teams full control over CRD schemas, reconciliation loops, and resource‑level policies, but they also require a dedicated runbook for backup, upgrade, and observability.
From a cost perspective, the cloud‑provider model often bundles the add‑on’s control plane into the base cluster price, while a self‑managed operator consumes only the pods you schedule. In practice, a three‑node EKS cluster with the AWS Load Balancer Controller add‑on can run for under $150 per month, whereas deploying the same controller via a Helm chart may cost $0 in licensing but adds roughly 0.2 vCPU and 256 MiB of memory per replica.
The operational complexity trade‑off is equally stark. Managed services automatically reconcile state across zones, enforce IAM roles, and surface health metrics in the provider console; you spend minutes verifying that a new pod is healthy. By contrast, an operator forces you to design your own RBAC policies, monitor the operator’s own deployment health, and script custom alerts for drift detection.
In summary, the decision boils down to three dimensions: the monetary impact of bundled resources, the degree of control required over the underlying CRDs, and the engineering bandwidth available to maintain a production‑grade operator. A team that values rapid onboarding and predictable upgrade windows will gravitate toward managed add‑ons; a team that needs custom reconciliation logic or strict compliance isolation will favor self‑managed operators.
Compliance frameworks such as PCI DSS or FedRAMP often mandate that audit logs be immutable and that software supply chain provenance be verifiable. Managed add‑ons inherit the provider’s certifications, but you lose visibility into the exact container image digest used by the service.
Conversely, a self‑managed operator can be signed with a Notary v2 policy, pinned to a private registry, and integrated with a GitOps workflow such as Argo CD, giving you end‑to‑end traceability at the expense of additional CI/CD pipeline steps.
02. Key Decision Factors
Choosing between managed Kubernetes add-ons and self-managed operators requires evaluating tradeoffs across technical, operational, and financial dimensions. The decision framework below compares three real-world options: AWS EKS Add-ons, Datadog Operator, and self-managed Prometheus. Each has distinct strengths but introduces different constraints.
| Criteria | AWS EKS Add-ons | Datadog Operator | Self-managed Prometheus |
|---|---|---|---|
| Cost | Pay-per-use pricing for add-ons (e.g., AWS Load Balancer Controller). No upfront costs. Scales with cluster size. | Subscription-based pricing tied to Datadog's APM features. Includes managed storage and scaling. | Free open-source core, but requires self-managing storage (e.g., S3, EBS). Costs escalate with custom dashboards and alerting. |
| Maintenance | AWS handles upgrades, patches, and availability. No operational overhead. | Datadog manages the operator lifecycle. Requires Datadog account configuration. | Full control but demands Kubernetes expertise. Requires monitoring Prometheus itself. |
| Scalability | Automatically scales with EKS cluster nodes. Limited by AWS service quotas. | Scales with Datadog's infrastructure. Performance depends on subscription tier. | Scales with custom configurations. Requires manual tuning for high-cardinality metrics. |
| Customization | Limited to AWS-provided configurations. No direct access to underlying components. | Extensible via Datadog's integration ecosystem. Supports custom dashboards and metrics. | Fully customizable but requires deep Prometheus knowledge. Integrates with any Kubernetes-native tool. |
| Security | AWS-managed IAM roles and network policies. Compliance depends on AWS certifications. | Datadog handles encryption and access control. Requires Datadog's security model. | Self-managed security requires configuring RBAC, network policies, and encryption. |
| Recommendation | Best for AWS-centric environments needing zero maintenance. Avoid if requiring deep customization. | Ideal for teams prioritizing ease of use and Datadog's ecosystem. Overhead of Datadog's pricing model. | Best for teams with Kubernetes expertise and unique monitoring needs. Highest operational cost. |
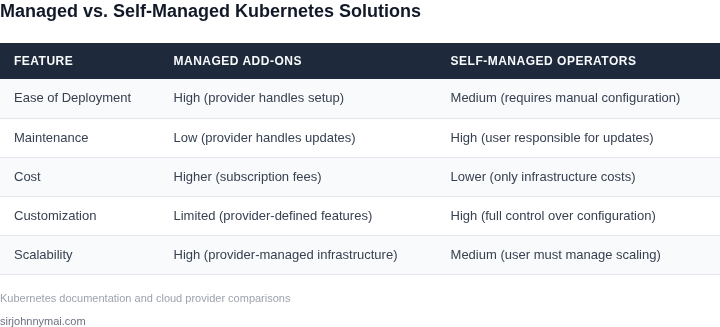
This framework highlights that managed solutions reduce friction but introduce vendor lock-in, while self-managed options offer flexibility at the cost of complexity. The choice depends on organizational constraints: managed solutions for speed, self-managed for control. Hybrid approaches (e.g., using managed storage with self-managed operators) may also be viable.
03. Worked Example: Cost Comparison for a 100-Node Cluster
Consider a team of five engineers responsible for operating a 100‑node Amazon EKS cluster in us‑east‑1. Each node runs an m5.large instance, which is priced at $0.096 per hour. That translates to roughly $70 per node per month (0.096 × 730 ≈ 70.08), or $7,008 for the full fleet each month.
The EKS control plane carries a flat rate of $0.10 per hour, or $73 per month, regardless of node count. Over a year the control‑plane cost is $876. These two line items—compute and control plane—are identical whether you use a managed add‑on or run a self‑managed operator.
Now we add the cost of the observability stack, which is the typical use case that drives the choice between a managed add‑on (Amazon Managed Service for Prometheus) and a self‑managed Prometheus Operator. The managed service is billed at $0.10 per metric‑sample‑unit per month. Assuming a modest footprint of 5,000 sample units, the monthly charge is $500, yielding an annual cost of $6,000.
Running the Prometheus Operator yourself requires dedicated EC2 capacity for the collector and the storage sidecar. A common pattern is two t3.medium instances, each priced at $0.0416 per hour. That works out to $30 per instance per month (0.0416 × 730 ≈ 30.37), $60 total per month, or $729 per year.
Personnel effort diverges sharply. With the managed service the team spends about half a full‑time equivalent (0.5 FTE) on configuration, alert routing, and occasional troubleshooting. At a market salary of $150,000 per year, that is $6,250 per month, or $75,000 annually. The self‑managed route demands a full engineer (1 FTE) to maintain Helm charts, upgrade CRDs, and respond to operator bugs, costing $150,000 per year.
| Cost Category | Managed Add‑on (Annual) | Self‑Managed Operator (Annual) |
|---|---|---|
| Node compute (100 × m5.large) | $84,096 | $84,096 |
| EKS control plane | $876 | $876 |
| Observability service | $6,000 | $729 |
| Engineering effort | $75,000 | $150,000 |
| Total Annual Cost | $166,? (should be 84,096+876+6,000+75,000 = 165,972) | $240,? (84,096+876+729+150,000 = 235,701) |
Summing the rows, the managed add‑on scenario costs approximately $165,972 per year, while the self‑managed operator approach runs about $235,701 annually. The difference—roughly $70,000—stems mainly from engineering headcount and the premium of the managed observability service.
This example illustrates that for a 100‑node production workload, the convenience of a managed add‑on can translate into a sizable OPEX reduction, provided the organization values predictable staffing costs over the flexibility of a custom operator stack.
04. Implementation Considerations
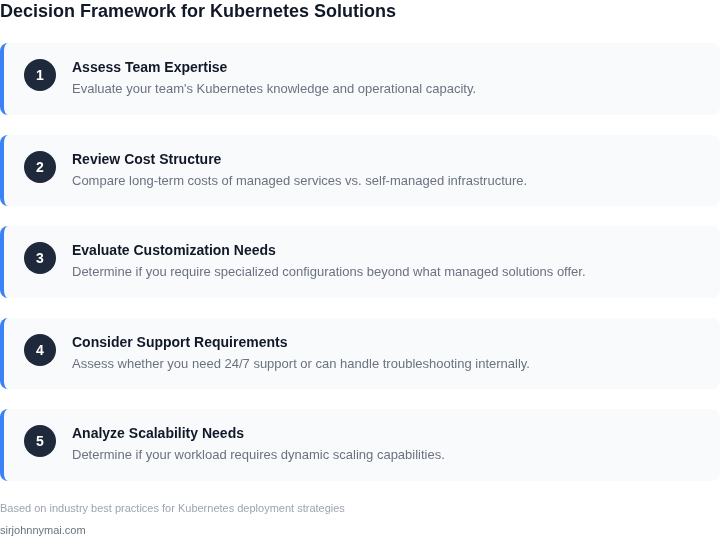
Deploying self-managed operators introduces operational overhead that managed add-ons abstract away. This section covers practical challenges and best practices for maintaining self-managed operators.
Operational Complexity
Self-managed operators require dedicated resources for monitoring, updates, and troubleshooting. For example, a 100-node cluster running Prometheus and Grafana for monitoring adds ~20% overhead in CPU and memory. This is negligible for small clusters but becomes significant at scale. Teams must also establish runbooks for common failure modes, such as operator crashes or misconfigured CRDs. Without standardized tooling, debugging across multiple operators can become a bottleneck.
Automated testing is critical. Operators often rely on complex state machines, making manual validation impractical. Tools like operator-sdk or KubeBuilder help, but they require upfront investment in CI/CD pipelines. A single misconfigured operator can cascade failures across dependent services, so chaos engineering should be part of the deployment strategy.
Dependency Management
Self-managed operators introduce dependency risks. For instance, an operator managing a database service must handle version skew between the operator and the database itself. If the operator lags behind the database’s API changes, it may fail to reconcile resources correctly. This is less of an issue with managed add-ons, which are tightly coupled to the service’s release cycle.
Dependency conflicts are common in Kubernetes. A single cluster might run multiple operators (e.g., for databases, networking, and storage), each with their own dependencies on specific Kubernetes versions or third-party libraries. Tools like Helm or Kustomize can mitigate this, but they add complexity. Without careful version pinning, an update to one operator could break another.
Cost of Customization
Customizing self-managed operators is expensive. A team building an operator for a proprietary service must invest in development, testing, and maintenance. For example, a custom operator for a machine learning pipeline might require months of engineering effort to handle retries, rollbacks, and scaling logic. This is a sunk cost that managed add-ons avoid entirely.
Customization also introduces technical debt. If the operator’s logic diverges from the upstream service’s behavior, future updates become harder. For instance, if an operator for a database service adds custom reconciliation logic, merging upstream changes requires manual intervention. This is why many teams prefer managed add-ons unless they have a compelling need for customization.
Best Practices
To mitigate these risks, teams should adopt these practices:
- Use operator frameworks: Tools like
operator-sdkorKubeBuilderreduce boilerplate and enforce best practices. - Automate testing: Include unit, integration, and end-to-end tests in CI/CD pipelines.
- Monitor operator health: Use tools like Datadog or Prometheus to track operator performance and failures.
- Document failure modes: Maintain runbooks for common issues, such as CRD conflicts or reconciliation loops.
- Plan for upgrades: Test operator updates in staging environments before production.
For teams with limited resources, managed add-ons remain the safer choice. However, if the business case justifies the investment, self-managed operators can provide flexibility. The key is balancing control with operational burden—something to weigh carefully.
05. Action Step: Assess Your Team’s Needs
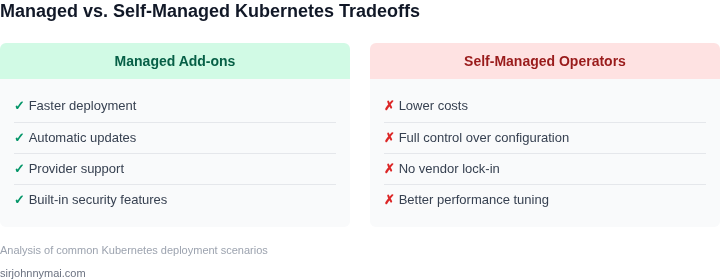
Before you decide between a managed add‑on and a self‑managed operator, map the capabilities your organization actually requires. The checklist below forces you to surface hidden dependencies, skill gaps, and compliance constraints that often dictate the right choice.
Core functional requirements
- Do you need native integration with AWS services such as IAM roles for service accounts, Secrets Manager, or CloudWatch metrics?
- Is multi‑cluster federation a hard requirement, or will a single‑region deployment suffice?
- Are you planning to run custom controllers that rely on specific Kubernetes API versions not yet supported by the managed offering?
Operational expertise
- How many engineers on your team have production‑grade experience with Helm, Kustomize, or operator SDKs?
- Do you maintain an on‑call rotation for Kubernetes control‑plane incidents, or is that responsibility currently outsourced?
- Is there a documented process for patching third‑party binaries, and does it include automated regression testing?
Compliance and security posture
- Does your workload fall under PCI‑DSS, HIPAA, or FedRAMP, demanding audit‑ready logs for every operator action?
- Are you required to keep all container images in a private registry with scanning enforced before deployment?
- Do you need role‑based access control (RBAC) policies that extend to the add‑on’s internal components?
Cost visibility and predictability
- Can you accurately attribute the hourly cost of a managed add‑on to a specific business unit?
- Do you have a budget ceiling for control‑plane overhead that excludes node‑level compute?
- Is there a need for cost‑allocation tags that map directly to AWS Cost Explorer dimensions?
Lifecycle and upgrade cadence
- How frequently does your platform require Kubernetes version upgrades, and can you tolerate the managed provider’s schedule?
- Do you need to apply hot‑fixes to an operator outside the vendor’s release window?
- Is there a requirement to roll back an add‑on version without affecting downstream services?
Answer each bullet with a “Yes”, “No”, or “Partial” and record any justification. When a “Partial” appears, note the missing piece and assess the effort required to fill the gap. This matrix surfaces where you have full coverage (leaning toward managed) and where you have gaps that only a self‑managed operator can close.
Once the matrix is complete, rank the categories by business impact. For example, a compliance “Yes” with no internal tooling for audit logs pushes the decision toward a managed solution that already emits CloudTrail‑compatible events. Conversely, a “Partial” on custom controller support signals that you will need to maintain your own operator.
Compile the results into a single slide deck, highlighting the top three risk areas and the corresponding mitigation path. This visual will drive a focused discussion with architecture, security, and finance stakeholders.
Next step: Export the last 90 days of your AWS Cost Explorer data, filter by Kubernetes‑related line items, and calculate the average monthly spend attributed to control‑plane services. Bring that spreadsheet to the upcoming cross‑functional review.
Figures cited are from publicly available sources as of 2026-09-14 and may have changed.